|
Download Data (XLS File) |
|
||||||||
|
||||||||
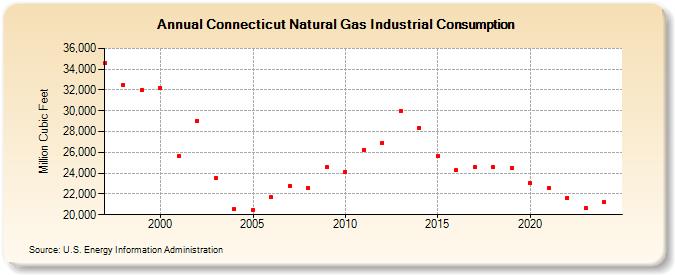
| Connecticut Natural Gas Industrial Consumption (Million Cubic Feet) | ||||||||
| Decade | Year-0 | Year-1 | Year-2 | Year-3 | Year-4 | Year-5 | Year-6 | Year-7 | Year-8 | Year-9 |
|---|---|---|---|---|---|---|---|---|---|---|
| 1990's | 34,554 | 32,498 | 32,039 | |||||||
| 2000's | 32,162 | 25,622 | 29,051 | 23,553 | 20,529 | 20,469 | 21,670 | 22,794 | 22,539 | 24,585 |
| 2010's | 24,117 | 26,258 | 26,932 | 29,965 | 28,371 | 25,612 | 24,271 | 24,557 | 24,562 | 24,520 |
| 2020's | 23,019 | 22,550 | 21,640 | 20,471 |
| - = No Data Reported; -- = Not Applicable; NA = Not Available; W = Withheld to avoid disclosure of individual company data. |
| Release Date: 3/29/2024 |
| Next Release Date: 4/30/2024 |