|
Download Data (XLS File) |
|
||||||||
|
||||||||
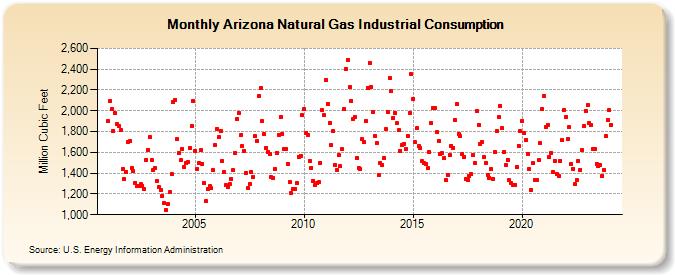
| Arizona Natural Gas Industrial Consumption (Million Cubic Feet) | ||||||||
| Year | Jan | Feb | Mar | Apr | May | Jun | Jul | Aug | Sep | Oct | Nov | Dec |
|---|---|---|---|---|---|---|---|---|---|---|---|---|
| 2001 | 1,898 | 2,093 | 2,015 | 1,810 | 1,975 | 1,872 | 1,853 | 1,813 | 1,439 | 1,344 | 1,412 | 1,704 |
| 2002 | 1,705 | 1,448 | 1,418 | 1,308 | 1,279 | 1,278 | 1,291 | 1,281 | 1,247 | 1,530 | 1,622 | 1,748 |
| 2003 | 1,527 | 1,431 | 1,448 | 1,325 | 1,262 | 1,242 | 1,181 | 1,112 | 1,045 | 1,101 | 1,214 | 1,390 |
| 2004 | 2,082 | 2,108 | 1,725 | 1,590 | 1,523 | 1,633 | 1,455 | 1,500 | 1,504 | 1,641 | 1,854 | 2,097 |
| 2005 | 1,617 | 1,442 | 1,498 | 1,620 | 1,491 | 1,303 | 1,131 | 1,251 | 1,273 | 1,253 | 1,427 | 1,669 |
| 2006 | 1,828 | 1,747 | 1,808 | 1,518 | 1,413 | 1,284 | 1,269 | 1,295 | 1,343 | 1,426 | 1,594 | 1,921 |
| 2007 | 1,983 | 1,763 | 1,660 | 1,613 | 1,402 | 1,254 | 1,297 | 1,410 | 1,362 | 1,758 | 1,713 | 2,141 |
| 2008 | 2,223 | 1,898 | 1,772 | 1,646 | 1,602 | 1,583 | 1,360 | 1,352 | 1,441 | 1,598 | 1,770 | 1,938 |
| 2009 | 1,780 | 1,636 | 1,631 | 1,489 | 1,317 | 1,207 | 1,245 | 1,250 | 1,307 | 1,560 | 1,568 | 1,957 |
| 2010 | 2,015 | 1,788 | 1,769 | 1,520 | 1,454 | 1,328 | 1,288 | 1,309 | 1,312 | 1,502 | 2,003 | 1,958 |
| 2011 | 2,300 | 2,067 | 1,884 | 1,669 | 1,807 | 1,476 | 1,431 | 1,573 | 1,464 | 1,629 | 2,021 | 2,401 |
| 2012 | 2,492 | 2,228 | 2,094 | 1,923 | 1,941 | 1,544 | 1,450 | 1,439 | 1,726 | 1,696 | 1,903 | 2,221 |
| 2013 | 2,463 | 2,230 | 1,985 | 1,758 | 1,687 | 1,381 | 1,496 | 1,477 | 1,547 | 1,820 | 1,992 | 2,317 |
| 2014 | 2,191 | 1,934 | 1,979 | 1,879 | 1,812 | 1,611 | 1,675 | 1,684 | 1,634 | 1,761 | 1,980 | 2,349 |
| 2015 | 2,115 | 1,695 | 1,831 | 1,659 | 1,644 | 1,512 | 1,498 | 1,487 | 1,446 | 1,604 | 1,882 | 2,029 |
| 2016 | 2,030 | 1,793 | 1,708 | 1,582 | 1,591 | 1,542 | 1,334 | 1,386 | 1,576 | 1,664 | 1,646 | 1,914 |
| 2017 | 2,064 | 1,780 | 1,753 | 1,582 | 1,560 | 1,348 | 1,331 | 1,373 | 1,387 | 1,573 | 1,498 | 1,999 |
| 2018 | 1,867 | 1,678 | 1,698 | 1,557 | 1,502 | 1,381 | 1,356 | 1,435 | 1,346 | 1,604 | 1,805 | 1,939 |
| 2019 | 2,044 | 1,834 | 1,602 | 1,478 | 1,531 | 1,330 | 1,303 | 1,287 | 1,290 | 1,458 | 1,665 | 1,803 |
| 2020 | 1,902 | 1,788 | 1,722 | 1,588 | 1,441 | 1,240 | 1,495 | 1,330 | 1,333 | 1,531 | 1,687 | 2,019 |
| 2021 | 2,143 | 1,844 | 1,864 | 1,554 | 1,597 | 1,407 | 1,521 | 1,393 | 1,377 | 1,520 | 1,717 | 2,004 |
| 2022 | 1,941 | 1,727 | 1,840 | 1,492 | 1,444 | 1,291 | 1,331 | 1,517 | 1,432 | 1,622 | 1,853 | 1,998 |
| 2023 | 2,055 | 1,878 | 1,860 | 1,633 | 1,633 | 1,489 | 1,465 | 1,474 | 1,376 | 1,431 | 1,753 | 1,907 |
| 2024 | 2,007 | 1,864 | ||||||||||
| - = No Data Reported; -- = Not Applicable; NA = Not Available; W = Withheld to avoid disclosure of individual company data. |
| Release Date: 4/30/2024 |
| Next Release Date: 5/31/2024 |