|
Download Data (XLS File) |
|
||||||||
|
||||||||
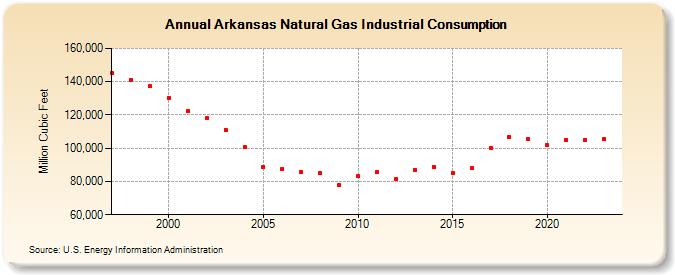
| Arkansas Natural Gas Industrial Consumption (Million Cubic Feet) | ||||||||
| Decade | Year-0 | Year-1 | Year-2 | Year-3 | Year-4 | Year-5 | Year-6 | Year-7 | Year-8 | Year-9 |
|---|---|---|---|---|---|---|---|---|---|---|
| 1990's | 144,938 | 141,010 | 137,326 | |||||||
| 2000's | 130,429 | 122,311 | 118,432 | 111,165 | 100,588 | 88,822 | 87,532 | 85,773 | 85,140 | 77,585 |
| 2010's | 83,061 | 85,437 | 81,597 | 87,077 | 88,797 | 85,287 | 87,876 | 100,256 | 106,692 | 105,280 |
| 2020's | 101,783 | 104,988 | 105,072 | 105,643 |
| - = No Data Reported; -- = Not Applicable; NA = Not Available; W = Withheld to avoid disclosure of individual company data. |
| Release Date: 3/29/2024 |
| Next Release Date: 4/30/2024 |