|
Download Data (XLS File) |
|
||||||||
|
||||||||
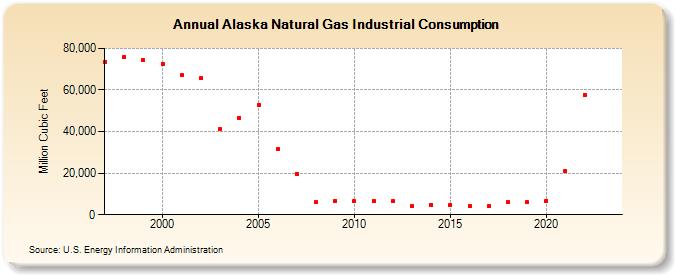
| Alaska Natural Gas Industrial Consumption (Million Cubic Feet) | ||||||||
| Decade | Year-0 | Year-1 | Year-2 | Year-3 | Year-4 | Year-5 | Year-6 | Year-7 | Year-8 | Year-9 |
|---|---|---|---|---|---|---|---|---|---|---|
| 1990's | 73,599 | 75,947 | 74,224 | |||||||
| 2000's | 72,694 | 67,174 | 65,693 | 41,166 | 46,742 | 52,887 | 31,457 | 19,751 | 5,987 | 6,635 |
| 2010's | 6,408 | 6,769 | 6,357 | 4,065 | 4,847 | 4,864 | 4,268 | 4,156 | 5,890 | 5,929 |
| 2020's | 6,796 | 20,935 | 57,799 | NA |
| - = No Data Reported; -- = Not Applicable; NA = Not Available; W = Withheld to avoid disclosure of individual company data. |
| Release Date: 4/30/2024 |
| Next Release Date: 5/31/2024 |