|
Download Data (XLS File) |
|
||||||||
|
||||||||
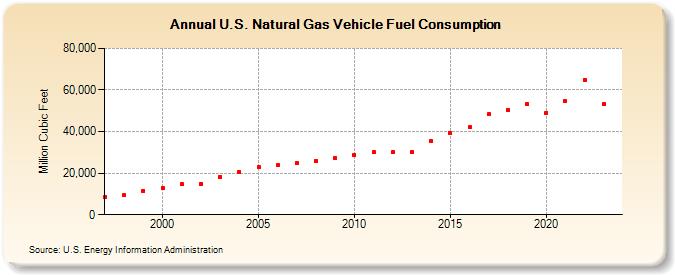
| U.S. Natural Gas Vehicle Fuel Consumption (Million Cubic Feet) | ||||||||
| Decade | Year-0 | Year-1 | Year-2 | Year-3 | Year-4 | Year-5 | Year-6 | Year-7 | Year-8 | Year-9 |
|---|---|---|---|---|---|---|---|---|---|---|
| 1990's | 8,328 | 9,341 | 11,622 | |||||||
| 2000's | 12,752 | 14,536 | 14,950 | 18,271 | 20,514 | 22,884 | 23,739 | 24,655 | 25,982 | 27,262 |
| 2010's | 28,664 | 29,974 | 29,970 | 30,045 | 35,282 | 39,390 | 42,028 | 48,204 | 50,413 | 53,166 |
| 2020's | 49,141 | 54,500 | 64,791 | 62,098 | 53,295 |
| - = No Data Reported; -- = Not Applicable; NA = Not Available; W = Withheld to avoid disclosure of individual company data. |
| Release Date: 9/30/2025 |
| Next Release Date: 10/31/2025 |