|
Download Data (XLS File) |
|
||||||||
|
||||||||
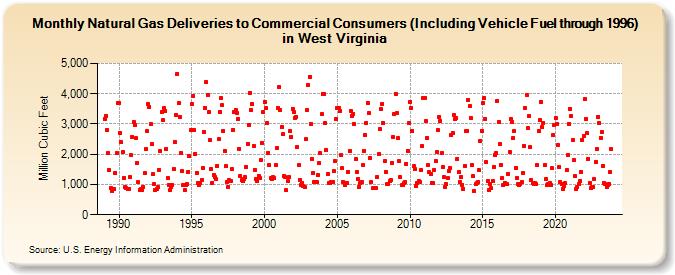
| Natural Gas Deliveries to Commercial Consumers (Including Vehicle Fuel through 1996) in West Virginia (Million Cubic Feet) | ||||||||
| Year | Jan | Feb | Mar | Apr | May | Jun | Jul | Aug | Sep | Oct | Nov | Dec |
|---|---|---|---|---|---|---|---|---|---|---|---|---|
| 1989 | 3,177 | 3,265 | 2,807 | 2,041 | 1,476 | 881 | 785 | 853 | 859 | 1,373 | 2,036 | 3,704 |
| 1990 | 3,701 | 2,707 | 2,391 | 2,064 | 1,224 | 924 | 889 | 845 | 862 | 1,237 | 1,963 | 2,585 |
| 1991 | 3,061 | 2,971 | 2,522 | 1,725 | 1,068 | 810 | 848 | 823 | 915 | 1,365 | 2,169 | 2,767 |
| 1992 | 3,659 | 3,565 | 2,986 | 2,322 | 1,341 | 999 | 812 | 855 | 910 | 1,482 | 2,092 | 3,396 |
| 1993 | 3,123 | 3,522 | 3,444 | 2,169 | 1,218 | 992 | 818 | 914 | 983 | 1,510 | 2,404 | 3,286 |
| 1994 | 4,653 | 3,681 | 3,246 | 2,031 | 1,437 | 982 | 812 | 973 | 1,009 | 1,428 | 1,927 | 2,800 |
| 1995 | 3,658 | 3,918 | 2,793 | 2,021 | 1,392 | 1,055 | 998 | 1,056 | 1,150 | 1,557 | 2,739 | 3,533 |
| 1996 | 4,383 | 3,959 | 3,393 | 2,457 | 1,511 | 1,062 | 1,317 | 1,259 | 1,171 | 1,620 | 2,494 | 3,400 |
| 1997 | 3,854 | 3,611 | 2,771 | 2,116 | 1,599 | 1,093 | 926 | 1,137 | 1,106 | 1,500 | 2,809 | 3,391 |
| 1998 | 3,463 | 3,363 | 3,154 | 2,176 | 1,273 | 1,146 | 1,102 | 1,185 | 1,237 | 1,579 | 2,345 | 2,963 |
| 1999 | 4,038 | 3,457 | 3,667 | 2,284 | 1,488 | 1,190 | 1,112 | 1,296 | 1,200 | 1,803 | 2,380 | 3,387 |
| 2000 | 3,727 | 3,519 | 3,048 | 2,033 | 1,638 | 1,203 | 1,173 | 1,235 | 1,211 | 1,634 | 2,209 | 3,536 |
| 2001 | 4,230 | 3,447 | 2,907 | 2,655 | 1,272 | 1,241 | 808 | 1,099 | 1,243 | 2,754 | 2,573 | 3,507 |
| 2002 | 3,387 | 3,213 | 3,239 | 2,246 | 1,633 | 1,152 | 998 | 1,042 | 953 | 926 | 2,487 | 3,453 |
| 2003 | 4,291 | 4,565 | 3,011 | 1,855 | 1,365 | 1,096 | 1,066 | 1,066 | 1,316 | 1,699 | 2,029 | 3,321 |
| 2004 | 4,007 | 3,996 | 3,036 | 2,142 | 1,342 | 1,054 | 1,056 | 1,089 | 1,090 | 1,439 | 1,765 | 3,162 |
| 2005 | 3,522 | 3,534 | 3,418 | 1,960 | 1,534 | 1,085 | 989 | 1,033 | 1,039 | 1,414 | 2,114 | 3,443 |
| 2006 | 3,272 | 3,335 | 3,007 | 1,829 | 1,420 | 1,171 | 927 | 1,035 | 1,083 | 1,633 | 2,120 | 2,646 |
| 2007 | 3,030 | 3,698 | 3,356 | 1,873 | 1,087 | 868 | 881 | 892 | 876 | 1,239 | 1,996 | 2,838 |
| 2008 | 3,484 | 3,672 | 3,030 | 1,767 | 1,416 | 1,005 | 1,031 | 1,115 | 1,140 | 1,725 | 2,575 | 3,341 |
| 2009 | 4,002 | 3,354 | 2,524 | 1,760 | 1,232 | 970 | 971 | 1,033 | 1,070 | 1,687 | 2,123 | 3,034 |
| 2010 | 3,736 | 3,531 | 2,759 | 1,596 | 1,515 | 948 | 1,045 | 1,111 | 1,071 | 1,474 | 2,269 | 3,853 |
| 2011 | 3,875 | 3,082 | 2,547 | 1,631 | 1,400 | 1,341 | 1,062 | 1,041 | 1,480 | 1,779 | 2,058 | 2,798 |
| 2012 | 3,237 | 3,112 | 2,034 | 1,568 | 1,231 | 920 | 1,004 | 1,198 | 1,453 | 1,547 | 2,625 | 2,704 |
| 2013 | 3,301 | 3,149 | 3,193 | 1,858 | 1,404 | 1,079 | 1,255 | 991 | 864 | 1,615 | 2,759 | 2,783 |
| 2014 | 3,787 | 3,585 | 3,199 | 1,643 | 1,269 | 786 | 1,015 | 1,035 | 1,086 | 1,470 | 2,447 | 2,778 |
| 2015 | 3,693 | 3,870 | 3,181 | 1,740 | 1,128 | 813 | 1,003 | 869 | 1,131 | 1,580 | 1,965 | 2,053 |
| 2016 | 3,768 | 3,075 | 2,330 | 1,656 | 1,216 | 989 | 1,065 | 1,007 | 999 | 1,350 | 2,079 | 3,164 |
| 2017 | 3,071 | 2,536 | 2,756 | 1,557 | 1,218 | 1,017 | 966 | 1,019 | 1,078 | 1,386 | 2,283 | 3,532 |
| 2018 | 3,959 | 2,854 | 3,263 | 2,224 | 1,132 | 1,045 | 999 | 1,061 | 1,004 | 1,634 | 2,761 | 3,125 |
| 2019 | 3,719 | 2,893 | 3,039 | 1,631 | 1,175 | 971 | 1,003 | 1,039 | 975 | 1,542 | 2,629 | 2,982 |
| 2020 | 3,191 | 3,010 | 2,311 | 1,588 | 1,075 | 1,025 | 858 | 937 | 1,039 | 1,475 | 1,974 | 3,008 |
| 2021 | 3,505 | 3,271 | 2,460 | 1,813 | 1,285 | 847 | 901 | 1,001 | 1,122 | 1,419 | 2,481 | 2,587 |
| 2022 | 3,823 | 3,173 | 2,707 | 1,854 | 1,050 | 893 | 911 | 910 | 1,172 | 1,752 | 2,175 | 3,245 |
| 2023 | 3,030 | 2,548 | 2,734 | 1,615 | 1,058 | 1,021 | 919 | 970 | 1,029 | 1,417 | 2,157 | NA |
| 2024 | NA | NA | ||||||||||
| - = No Data Reported; -- = Not Applicable; NA = Not Available; W = Withheld to avoid disclosure of individual company data. |
| Release Date: 4/30/2024 |
| Next Release Date: 5/31/2024 |