|
Download Data (XLS File) |
|
||||||||
|
||||||||
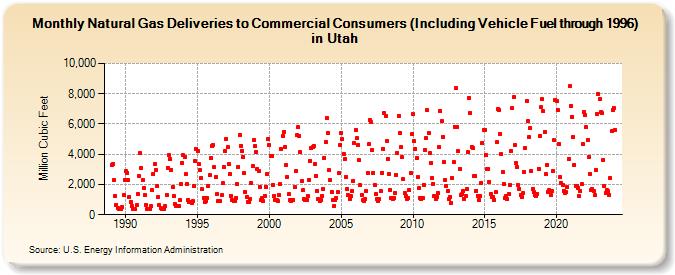
| Natural Gas Deliveries to Commercial Consumers (Including Vehicle Fuel through 1996) in Utah (Million Cubic Feet) | ||||||||
| Year | Jan | Feb | Mar | Apr | May | Jun | Jul | Aug | Sep | Oct | Nov | Dec |
|---|---|---|---|---|---|---|---|---|---|---|---|---|
| 1989 | 3,283 | 3,376 | 2,280 | 1,227 | 653 | 472 | 357 | 346 | 390 | 522 | 1,313 | 2,304 |
| 1990 | 2,864 | 2,779 | 2,272 | 1,203 | 860 | 581 | 373 | 364 | 374 | 629 | 1,382 | 2,540 |
| 1991 | 4,055 | 3,108 | 2,282 | 1,771 | 1,316 | 668 | 405 | 375 | 407 | 551 | 1,634 | 2,704 |
| 1992 | 3,330 | 2,952 | 1,866 | 1,155 | 642 | 457 | 410 | 372 | 405 | 545 | 1,329 | 3,120 |
| 1993 | 3,922 | 3,682 | 2,988 | 1,839 | 1,248 | 707 | 597 | 594 | 606 | 946 | 2,023 | 3,436 |
| 1994 | 3,929 | 3,846 | 2,665 | 2,037 | 962 | 814 | 820 | 787 | 882 | 1,883 | 3,542 | 4,335 |
| 1995 | 4,244 | 3,324 | 2,948 | 2,429 | 1,675 | 1,122 | 861 | 899 | 1,088 | 1,905 | 2,605 | 3,724 |
| 1996 | 4,549 | 4,604 | 3,129 | 2,479 | 1,356 | 892 | 904 | 874 | 1,279 | 2,073 | 3,185 | 4,220 |
| 1997 | 5,030 | 4,454 | 3,350 | 2,664 | 1,263 | 942 | 923 | 939 | 1,120 | 2,012 | 3,174 | 5,257 |
| 1998 | 4,553 | 4,243 | 3,795 | 2,755 | 1,513 | 1,156 | 847 | 845 | 1,028 | 2,083 | 3,202 | 4,934 |
| 1999 | 4,557 | 4,177 | 3,053 | 2,905 | 1,849 | 984 | 1,085 | 898 | 1,252 | 1,864 | 2,711 | 5,026 |
| 2000 | 4,605 | 3,893 | 3,889 | 1,993 | 1,240 | 954 | 955 | 919 | 1,308 | 2,000 | 4,320 | 5,205 |
| 2001 | 5,472 | 4,504 | 3,272 | 2,505 | 1,368 | 961 | 926 | 961 | 992 | 1,834 | 2,870 | 5,250 |
| 2002 | 5,779 | 5,206 | 4,127 | 2,220 | 1,618 | 1,051 | 950 | 994 | 1,257 | 2,327 | 3,580 | 4,392 |
| 2003 | 4,469 | 4,544 | 3,359 | 2,577 | 1,592 | 1,026 | 902 | 973 | 1,243 | 1,718 | 3,783 | 4,807 |
| 2004 | 6,396 | 5,407 | 2,934 | 2,327 | 1,487 | 992 | 606 | 982 | 1,131 | 1,530 | 2,736 | 4,627 |
| 2005 | 5,436 | 4,994 | 4,027 | 3,658 | 2,513 | 1,684 | 1,299 | 1,059 | 1,224 | 1,560 | 2,251 | 4,741 |
| 2006 | 5,634 | 5,045 | 4,625 | 3,585 | 1,943 | 1,316 | 944 | 911 | 1,049 | 1,570 | 2,787 | 4,643 |
| 2007 | 6,273 | 6,100 | 4,248 | 2,780 | 1,976 | 1,368 | 1,029 | 937 | 1,023 | 1,546 | 2,791 | 4,377 |
| 2008 | 6,720 | 6,548 | 4,875 | 3,715 | 2,671 | 1,648 | 1,114 | 1,032 | 1,095 | 1,440 | 2,655 | 4,098 |
| 2009 | 6,554 | 5,396 | 4,450 | 3,795 | 2,352 | 1,466 | 1,213 | 1,024 | 1,090 | 1,619 | 2,759 | 5,306 |
| 2010 | 6,629 | 4,852 | 4,354 | 3,740 | 2,480 | 1,797 | 1,137 | 1,012 | 1,110 | 1,992 | 4,284 | 5,074 |
| 2011 | 6,891 | 5,401 | 4,063 | 3,437 | 2,458 | 2,057 | 1,225 | 1,022 | 1,152 | 1,421 | 4,464 | 6,854 |
| 2012 | 6,173 | 5,162 | 3,475 | 2,304 | 1,925 | 1,586 | 1,042 | 1,200 | 776 | 2,435 | 3,468 | 5,816 |
| 2013 | 8,353 | 5,779 | 4,192 | 3,048 | 1,288 | 1,377 | 1,552 | 1,057 | 1,214 | 1,686 | 4,130 | 7,723 |
| 2014 | 6,726 | 4,485 | 4,397 | 2,532 | 2,538 | 1,586 | 1,257 | 940 | 1,227 | 2,117 | 4,741 | 5,611 |
| 2015 | 5,620 | 3,979 | 3,004 | 3,027 | 2,168 | 1,387 | 1,181 | 1,170 | 1,003 | 1,491 | 4,785 | 6,958 |
| 2016 | 6,937 | 5,361 | 4,002 | 2,794 | 2,026 | 1,083 | 1,245 | 1,036 | 1,358 | 1,971 | 4,221 | 7,032 |
| 2017 | 7,780 | 4,609 | 3,419 | 3,171 | 1,958 | 1,727 | 1,281 | 1,197 | 1,435 | 2,792 | 4,406 | 7,489 |
| 2018 | 6,175 | 5,146 | 5,707 | 2,902 | 1,709 | 1,484 | 1,286 | 1,223 | 1,357 | 3,055 | 5,229 | 7,093 |
| 2019 | 7,643 | 6,832 | 5,473 | 2,660 | 3,311 | 1,513 | 1,638 | 1,278 | 1,574 | 2,867 | 4,963 | 7,584 |
| 2020 | 7,508 | 6,916 | 4,678 | 2,505 | 2,088 | 1,981 | 1,598 | 1,447 | 1,473 | 1,846 | 3,688 | 8,487 |
| 2021 | 7,190 | 6,483 | 5,150 | 3,318 | 1,921 | 1,913 | 1,784 | 1,236 | 1,539 | 2,010 | 4,667 | 6,759 |
| 2022 | 6,565 | 5,773 | 4,933 | 3,816 | 2,712 | 1,609 | 1,690 | 1,598 | 1,281 | 2,987 | 6,648 | 7,989 |
| 2023 | 7,622 | 6,781 | 6,724 | 3,648 | 1,907 | 1,458 | 1,608 | 1,549 | 1,311 | 2,443 | 5,542 | 6,938 |
| 2024 | 7,052 | |||||||||||
| - = No Data Reported; -- = Not Applicable; NA = Not Available; W = Withheld to avoid disclosure of individual company data. |
| Release Date: 3/29/2024 |
| Next Release Date: 4/30/2024 |