|
Download Data (XLS File) |
|
||||||||
|
||||||||
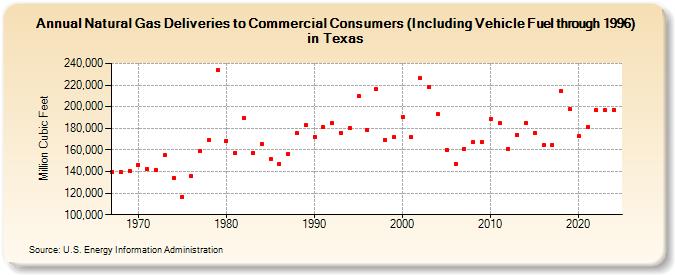
| Natural Gas Deliveries to Commercial Consumers (Including Vehicle Fuel through 1996) in Texas (Million Cubic Feet) | ||||||||
| Decade | Year-0 | Year-1 | Year-2 | Year-3 | Year-4 | Year-5 | Year-6 | Year-7 | Year-8 | Year-9 |
|---|---|---|---|---|---|---|---|---|---|---|
| 1960's | 139,727 | 139,442 | 140,854 | |||||||
| 1970's | 146,090 | 142,423 | 141,128 | 155,070 | 134,418 | 116,749 | 135,452 | 158,683 | 168,946 | 233,758 |
| 1980's | 168,513 | 157,199 | 189,447 | 157,481 | 165,700 | 151,774 | 146,972 | 156,509 | 175,368 | 182,670 |
| 1990's | 172,333 | 180,973 | 184,673 | 175,988 | 180,232 | 209,584 | 178,549 | 216,333 | 169,610 | 171,714 |
| 2000's | 190,453 | 171,847 | 226,274 | 218,565 | 192,901 | 159,972 | 147,366 | 161,255 | 167,129 | 167,315 |
| 2010's | 188,796 | 184,475 | 161,273 | 173,809 | 184,908 | 175,883 | 164,306 | 164,782 | 214,173 | 198,060 |
| 2020's | 172,627 | 181,378 | 196,649 | 191,425 |
| - = No Data Reported; -- = Not Applicable; NA = Not Available; W = Withheld to avoid disclosure of individual company data. |
| Release Date: 3/29/2024 |
| Next Release Date: 4/30/2024 |