|
Download Data (XLS File) |
|
||||||||
|
||||||||
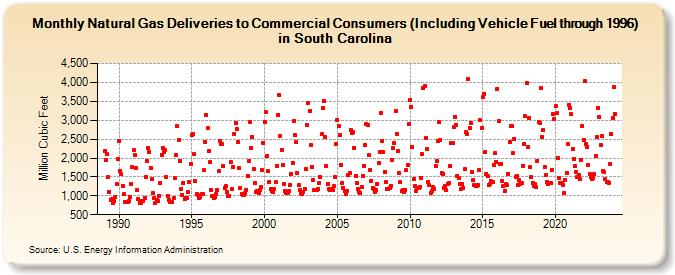
| Natural Gas Deliveries to Commercial Consumers (Including Vehicle Fuel through 1996) in South Carolina (Million Cubic Feet) | ||||||||
| Year | Jan | Feb | Mar | Apr | May | Jun | Jul | Aug | Sep | Oct | Nov | Dec |
|---|---|---|---|---|---|---|---|---|---|---|---|---|
| 1989 | 2,176 | 1,936 | 2,098 | 1,489 | 1,094 | 891 | 908 | 808 | 866 | 970 | 1,324 | 1,964 |
| 1990 | 2,455 | 1,649 | 1,576 | 1,262 | 1,040 | 846 | 836 | 830 | 872 | 965 | 1,315 | 1,749 |
| 1991 | 2,199 | 2,076 | 1,746 | 1,143 | 908 | 818 | 810 | 859 | 875 | 952 | 1,492 | 1,917 |
| 1992 | 2,276 | 2,158 | 1,745 | 1,436 | 1,068 | 944 | 820 | 882 | 875 | 1,006 | 1,345 | 2,089 |
| 1993 | 2,268 | 2,155 | 2,200 | 1,507 | 1,007 | 877 | 832 | 840 | 846 | 947 | 1,463 | 2,070 |
| 1994 | 2,845 | 2,472 | 1,910 | 1,174 | 1,027 | 1,342 | 913 | 949 | 947 | 1,089 | 1,361 | 1,843 |
| 1995 | 2,600 | 2,626 | 2,111 | 1,382 | 1,045 | 1,013 | 950 | 956 | 1,044 | 1,054 | 1,674 | 2,414 |
| 1996 | 3,136 | 2,782 | 2,190 | 1,884 | 1,154 | 997 | 940 | 957 | 1,041 | 1,157 | 1,644 | 2,447 |
| 1997 | 2,378 | 2,381 | 1,793 | 1,202 | 1,268 | 1,096 | 989 | 1,004 | 1,884 | 1,167 | 1,757 | 2,639 |
| 1998 | 2,929 | 2,770 | 2,417 | 1,728 | 1,208 | 1,058 | 1,011 | 1,028 | 1,065 | 1,156 | 1,531 | 1,926 |
| 1999 | 2,955 | 2,258 | 2,549 | 1,720 | 1,337 | 1,103 | 1,120 | 1,067 | 1,148 | 1,229 | 1,681 | 2,399 |
| 2000 | 2,958 | 3,212 | 2,044 | 1,656 | 1,366 | 1,177 | 1,119 | 1,107 | 1,180 | 1,354 | 1,784 | 3,148 |
| 2001 | 3,672 | 2,595 | 2,220 | 1,816 | 1,308 | 1,116 | 1,067 | 1,076 | 1,118 | 1,298 | 1,585 | 1,870 |
| 2002 | 2,987 | 2,605 | 2,433 | 1,596 | 1,276 | 1,151 | 1,072 | 1,037 | 1,114 | 1,186 | 1,698 | 2,875 |
| 2003 | 3,444 | 3,237 | 2,357 | 1,771 | 1,428 | 1,160 | 1,155 | 1,151 | 1,170 | 1,348 | 1,505 | 2,640 |
| 2004 | 3,321 | 3,502 | 2,549 | 1,782 | 1,311 | 1,175 | 1,158 | 1,180 | 1,164 | 1,253 | 1,502 | 2,358 |
| 2005 | 3,005 | 2,841 | 2,600 | 1,818 | 1,347 | 1,219 | 1,140 | 1,056 | 1,122 | 1,549 | 1,601 | 2,750 |
| 2006 | 2,657 | 2,683 | 2,266 | 1,532 | 1,342 | 1,174 | 1,106 | 1,063 | 1,234 | 1,518 | 1,785 | 2,332 |
| 2007 | 2,889 | 2,872 | 2,069 | 1,676 | 1,398 | 1,207 | 1,183 | 1,113 | 1,153 | 1,322 | 1,879 | 2,166 |
| 2008 | 3,198 | 2,459 | 2,163 | 1,641 | 1,359 | 1,189 | 1,191 | 1,205 | 1,267 | 1,958 | 2,255 | 2,398 |
| 2009 | 3,239 | 2,626 | 2,174 | 1,600 | 1,353 | 1,131 | 1,157 | 1,101 | 1,153 | 1,684 | 1,826 | 2,909 |
| 2010 | 3,527 | 3,359 | 2,287 | 1,456 | 1,264 | 1,138 | 1,195 | 1,212 | 1,246 | 1,479 | 2,101 | 3,856 |
| 2011 | 3,895 | 2,534 | 2,237 | 1,359 | 1,284 | 1,081 | 1,140 | 1,220 | 1,186 | 1,801 | 1,922 | 2,456 |
| 2012 | 2,947 | 2,475 | 1,614 | 1,578 | 1,200 | 1,254 | 1,143 | 1,309 | 1,328 | 1,782 | 2,389 | 2,396 |
| 2013 | 2,820 | 3,094 | 2,883 | 1,536 | 1,481 | 1,303 | 1,187 | 1,311 | 1,200 | 1,706 | 2,695 | 2,647 |
| 2014 | 4,082 | 2,784 | 2,931 | 1,620 | 1,412 | 1,286 | 1,255 | 1,267 | 1,285 | 1,687 | 3,001 | 2,789 |
| 2015 | 3,611 | 3,690 | 2,153 | 1,585 | 1,516 | 1,299 | 1,316 | 1,380 | 1,371 | 1,815 | 2,122 | 1,894 |
| 2016 | 3,836 | 2,982 | 1,845 | 1,849 | 1,395 | 1,255 | 1,135 | 1,300 | 1,284 | 1,588 | 2,424 | 2,840 |
| 2017 | 2,839 | 2,124 | 2,511 | 1,501 | 1,527 | 1,284 | 1,406 | 1,313 | 1,326 | 1,799 | 2,383 | 3,116 |
| 2018 | 3,995 | 2,285 | 3,064 | 1,752 | 1,487 | 1,343 | 1,272 | 1,303 | 1,231 | 1,926 | 2,955 | 2,939 |
| 2019 | 3,863 | 2,552 | 2,731 | 1,765 | 1,547 | 1,375 | 1,315 | 1,346 | 1,335 | 1,683 | 3,163 | 3,030 |
| 2020 | 3,376 | 3,179 | 2,008 | 1,474 | 1,335 | 1,334 | 1,285 | 1,077 | 1,424 | 1,610 | 2,361 | 3,412 |
| 2021 | 3,310 | 3,161 | 2,243 | 1,975 | 1,780 | 1,625 | 1,486 | 1,555 | 1,449 | 1,942 | 2,859 | 2,469 |
| 2022 | 4,030 | 2,363 | 2,296 | 1,817 | 1,570 | 1,499 | 1,453 | 1,459 | 1,564 | 2,043 | 2,568 | 3,324 |
| 2023 | 3,081 | 2,341 | 2,575 | 1,664 | 1,621 | 1,432 | 1,378 | 1,355 | 1,340 | 1,843 | 2,648 | 3,055 |
| 2024 | 3,876 | |||||||||||
| - = No Data Reported; -- = Not Applicable; NA = Not Available; W = Withheld to avoid disclosure of individual company data. |
| Release Date: 3/29/2024 |
| Next Release Date: 4/30/2024 |