|
Download Data (XLS File) |
|
||||||||
|
||||||||
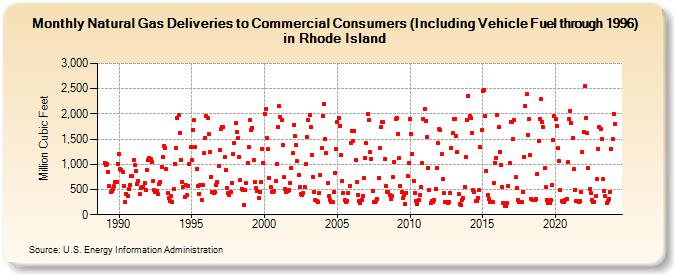
| Natural Gas Deliveries to Commercial Consumers (Including Vehicle Fuel through 1996) in Rhode Island (Million Cubic Feet) | ||||||||
| Year | Jan | Feb | Mar | Apr | May | Jun | Jul | Aug | Sep | Oct | Nov | Dec |
|---|---|---|---|---|---|---|---|---|---|---|---|---|
| 1989 | 1,032 | 979 | 1,003 | 855 | 565 | 457 | 471 | 518 | 560 | 657 | 654 | 1,014 |
| 1990 | 1,195 | 903 | 893 | 857 | 577 | 244 | 413 | 365 | 508 | 587 | 763 | 774 |
| 1991 | 1,089 | 979 | 864 | 605 | 667 | 414 | 538 | 540 | 555 | 628 | 496 | 895 |
| 1992 | 1,076 | 1,128 | 1,103 | 1,047 | 676 | 498 | 448 | 479 | 411 | 609 | 654 | 951 |
| 1993 | 1,140 | 1,359 | 1,325 | 907 | 429 | 330 | 273 | 364 | 243 | 503 | 1,008 | 1,324 |
| 1994 | 1,919 | 1,974 | 1,626 | 1,092 | 653 | 542 | 343 | 599 | 384 | 569 | 1,010 | 1,338 |
| 1995 | 1,077 | 1,679 | 1,883 | 1,353 | 901 | 562 | 413 | 582 | 294 | 580 | 1,216 | 1,523 |
| 1996 | 1,963 | 1,919 | 1,606 | 1,251 | 757 | 446 | 421 | 443 | 581 | 648 | 972 | 1,290 |
| 1997 | 1,694 | 1,744 | 1,739 | 1,144 | 892 | 537 | 430 | 399 | 460 | 637 | 1,211 | 1,416 |
| 1998 | 1,817 | 1,642 | 1,518 | 1,141 | 694 | 506 | 496 | 195 | 483 | 628 | 1,019 | 1,338 |
| 1999 | 1,888 | 1,682 | 1,727 | 1,082 | 649 | 525 | 480 | 333 | 453 | 650 | 1,307 | 1,027 |
| 2000 | 2,006 | 2,100 | 1,514 | 1,303 | 726 | 541 | 443 | 447 | 479 | 667 | 999 | 1,749 |
| 2001 | 2,149 | 1,931 | 1,882 | 1,382 | 743 | 511 | 460 | 465 | 492 | 635 | 934 | 1,222 |
| 2002 | 1,789 | 1,566 | 1,379 | 1,074 | 787 | 540 | 412 | 392 | 429 | 556 | 1,001 | 1,544 |
| 2003 | 1,884 | 1,970 | 1,744 | 1,191 | 757 | 460 | 288 | 281 | 256 | 440 | 787 | 1,332 |
| 2004 | 1,964 | 2,202 | 1,510 | 1,221 | 623 | 362 | 297 | 262 | 262 | 447 | 829 | 1,308 |
| 2005 | 1,847 | 1,915 | 1,762 | 1,192 | 662 | 428 | 282 | 245 | 276 | 440 | 579 | 1,413 |
| 2006 | 1,668 | 1,458 | 1,657 | 1,085 | 649 | 392 | 269 | 234 | 298 | 381 | 734 | 1,126 |
| 2007 | 1,413 | 2,006 | 1,872 | 1,239 | 1,101 | 467 | 257 | 246 | 269 | 310 | 737 | 1,329 |
| 2008 | 1,747 | 1,844 | 1,832 | 1,100 | 562 | 452 | 456 | 393 | 303 | 367 | 750 | 1,037 |
| 2009 | 1,890 | 1,921 | 1,608 | 1,119 | 565 | 449 | 339 | 396 | 211 | 439 | 762 | 1,026 |
| 2010 | 1,900 | 1,603 | 1,209 | 666 | 435 | 274 | 219 | 291 | 388 | 546 | 1,029 | 1,899 |
| 2011 | 2,089 | 1,868 | 1,543 | 930 | 497 | 241 | 275 | 247 | 287 | 518 | 927 | 1,419 |
| 2012 | 1,705 | 1,674 | 1,210 | 709 | 428 | 251 | 256 | 236 | 255 | 440 | 1,315 | 1,612 |
| 2013 | 1,899 | 1,907 | 1,553 | 1,244 | 414 | 213 | 195 | 298 | 331 | 557 | 1,135 | 1,887 |
| 2014 | 2,364 | 1,967 | 1,914 | 1,622 | 485 | 442 | 265 | 281 | 328 | 484 | 1,336 | 1,690 |
| 2015 | 2,463 | 2,477 | 1,949 | 872 | 385 | 309 | 262 | 253 | 247 | 638 | 1,030 | 1,132 |
| 2016 | 1,983 | 1,747 | 1,247 | 977 | 549 | 234 | 174 | 167 | 233 | 572 | 1,019 | 1,843 |
| 2017 | 1,840 | 1,501 | 1,883 | 749 | 536 | 297 | 262 | 256 | 252 | 447 | 1,154 | 2,161 |
| 2018 | 2,391 | 1,582 | 1,889 | 1,187 | 315 | 291 | 292 | 287 | 309 | 814 | 1,471 | 1,904 |
| 2019 | 2,298 | 1,842 | 1,731 | 919 | 550 | 300 | 228 | 238 | 288 | 582 | 1,487 | 1,953 |
| 2020 | 1,895 | 1,765 | 1,317 | 1,062 | 481 | 265 | 245 | 243 | 282 | 318 | 1,040 | 1,894 |
| 2021 | 2,063 | 1,823 | 1,530 | 910 | 496 | 281 | 268 | 253 | 271 | 459 | 1,242 | 1,639 |
| 2022 | 2,547 | 1,924 | 1,617 | 921 | 506 | 430 | 290 | 259 | 261 | 364 | 704 | 1,304 |
| 2023 | 1,740 | 1,700 | 1,503 | 700 | 469 | 363 | 239 | 265 | 307 | 458 | 1,303 | 1,497 |
| 2024 | 2,002 | |||||||||||
| - = No Data Reported; -- = Not Applicable; NA = Not Available; W = Withheld to avoid disclosure of individual company data. |
| Release Date: 3/29/2024 |
| Next Release Date: 4/30/2024 |