|
Download Data (XLS File) |
|
||||||||
|
||||||||
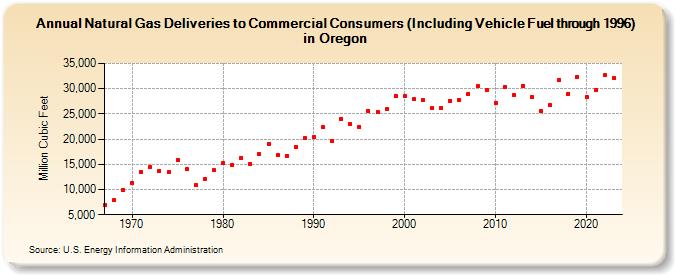
| Natural Gas Deliveries to Commercial Consumers (Including Vehicle Fuel through 1996) in Oregon (Million Cubic Feet) | ||||||||
| Decade | Year-0 | Year-1 | Year-2 | Year-3 | Year-4 | Year-5 | Year-6 | Year-7 | Year-8 | Year-9 |
|---|---|---|---|---|---|---|---|---|---|---|
| 1960's | 6,961 | 7,874 | 9,965 | |||||||
| 1970's | 11,360 | 13,563 | 14,530 | 13,722 | 13,401 | 15,896 | 13,995 | 10,861 | 12,124 | 13,820 |
| 1980's | 15,171 | 14,922 | 16,330 | 15,143 | 17,012 | 19,043 | 16,843 | 16,718 | 18,406 | 20,249 |
| 1990's | 20,449 | 22,328 | 19,570 | 24,047 | 22,960 | 22,419 | 25,597 | 25,465 | 25,986 | 28,510 |
| 2000's | 28,589 | 27,884 | 27,714 | 26,110 | 26,214 | 27,631 | 27,844 | 29,007 | 30,444 | 29,744 |
| 2010's | 27,246 | 30,359 | 28,805 | 30,566 | 28,377 | 25,602 | 26,667 | 31,763 | 28,997 | 32,379 |
| 2020's | 28,351 | 29,700 | 32,634 | 32,207 |
| - = No Data Reported; -- = Not Applicable; NA = Not Available; W = Withheld to avoid disclosure of individual company data. |
| Release Date: 3/29/2024 |
| Next Release Date: 4/30/2024 |