|
Download Data (XLS File) |
|
||||||||
|
||||||||
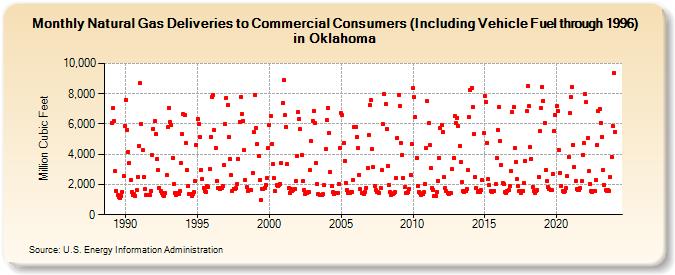
| Natural Gas Deliveries to Commercial Consumers (Including Vehicle Fuel through 1996) in Oklahoma (Million Cubic Feet) | ||||||||
| Year | Jan | Feb | Mar | Apr | May | Jun | Jul | Aug | Sep | Oct | Nov | Dec |
|---|---|---|---|---|---|---|---|---|---|---|---|---|
| 1989 | 6,069 | 7,033 | 6,197 | 2,868 | 1,601 | 1,279 | 1,180 | 1,097 | 1,241 | 1,528 | 2,542 | 5,873 |
| 1990 | 7,587 | 5,618 | 4,176 | 3,424 | 2,281 | 1,519 | 1,312 | 1,355 | 1,235 | 1,613 | 2,520 | 4,567 |
| 1991 | 8,702 | 6,014 | 4,265 | 2,489 | 1,702 | 1,330 | 1,290 | 1,279 | 1,299 | 1,590 | 3,974 | 5,653 |
| 1992 | 6,180 | 5,310 | 3,653 | 2,956 | 1,785 | 1,540 | 1,407 | 1,292 | 1,240 | 1,449 | 2,608 | 5,771 |
| 1993 | 7,076 | 6,147 | 5,910 | 3,743 | 2,057 | 1,439 | 1,324 | 1,432 | 1,345 | 1,544 | 3,424 | 5,327 |
| 1994 | 6,644 | 6,611 | 4,717 | 2,954 | 1,875 | 1,384 | 1,364 | 1,256 | 1,384 | 1,475 | 2,207 | 4,632 |
| 1995 | 6,358 | 6,001 | 5,160 | 2,968 | 2,354 | 1,794 | 1,558 | 1,524 | 1,903 | 1,836 | 3,020 | 5,164 |
| 1996 | 7,808 | 7,923 | 5,595 | 4,413 | 2,222 | 1,770 | 1,798 | 1,678 | 1,759 | 1,900 | 3,273 | 6,014 |
| 1997 | 7,750 | 7,268 | 5,138 | 3,659 | 2,616 | 1,567 | 1,728 | 1,730 | 1,760 | 2,059 | 3,668 | 6,143 |
| 1998 | 7,787 | 6,692 | 6,218 | 4,249 | 2,315 | 1,808 | 1,585 | 1,641 | 1,628 | 1,644 | 2,771 | 5,463 |
| 1999 | 7,942 | 5,744 | 4,673 | 3,862 | 2,302 | 970 | 1,731 | 1,709 | 1,798 | 1,982 | 2,433 | 4,420 |
| 2000 | 5,937 | 6,539 | 4,662 | 3,358 | 2,399 | 1,545 | 1,941 | 1,900 | 1,962 | 2,064 | 3,428 | 7,389 |
| 2001 | 8,895 | 6,563 | 5,805 | 3,329 | 1,764 | 1,456 | 1,731 | 1,579 | 1,667 | 1,693 | 2,207 | 3,869 |
| 2002 | 6,805 | 6,341 | 5,664 | 3,965 | 2,217 | 1,639 | 1,387 | 1,465 | 1,477 | 1,482 | 2,941 | 4,846 |
| 2003 | 6,228 | 6,889 | 6,060 | 3,426 | 2,004 | 1,371 | 1,274 | 1,294 | 1,315 | 1,341 | 1,942 | 4,328 |
| 2004 | 6,258 | 7,081 | 5,392 | 2,831 | 1,914 | 1,470 | 1,360 | 1,438 | 1,446 | 1,448 | 2,039 | 4,425 |
| 2005 | 6,721 | 6,588 | 4,709 | 3,573 | 2,129 | 1,663 | 1,440 | 1,466 | 1,482 | 1,494 | 2,322 | 5,772 |
| 2006 | 5,807 | 5,145 | 4,386 | 2,655 | 1,678 | 1,421 | 1,426 | 1,344 | 1,506 | 1,792 | 3,060 | 5,272 |
| 2007 | 7,231 | 7,570 | 4,334 | 3,129 | 1,887 | 1,604 | 1,487 | 1,471 | 1,463 | 1,753 | 2,942 | 5,975 |
| 2008 | 7,996 | 7,313 | 5,657 | 3,236 | 1,993 | 1,473 | 1,335 | 1,360 | 1,405 | 1,508 | 2,413 | 5,083 |
| 2009 | 7,939 | 7,192 | 4,770 | 3,940 | 2,451 | 1,805 | 1,410 | 1,407 | 1,482 | 1,722 | 2,649 | 4,654 |
| 2010 | 8,353 | 7,752 | 6,443 | 3,782 | 1,922 | 1,526 | 1,424 | 1,316 | 1,379 | 1,471 | 2,038 | 4,415 |
| 2011 | 7,502 | 6,047 | 4,586 | 3,096 | 1,766 | 1,664 | 1,248 | 1,230 | 1,523 | 2,256 | 3,767 | 5,707 |
| 2012 | 5,955 | 5,437 | 2,496 | 1,739 | 1,546 | 1,414 | 1,339 | 1,463 | 1,430 | 3,004 | 3,772 | 6,511 |
| 2013 | 6,069 | 6,423 | 5,878 | 4,555 | 3,462 | 2,135 | 1,567 | 1,490 | 1,585 | 1,690 | 2,934 | 6,449 |
| 2014 | 8,230 | 8,380 | 7,102 | 5,343 | 2,464 | 1,744 | 1,509 | 1,546 | 1,476 | 1,605 | 2,265 | 5,378 |
| 2015 | 7,824 | 7,445 | 4,768 | 2,349 | 1,941 | 1,541 | 1,530 | 1,566 | 1,599 | 2,030 | 3,758 | 5,631 |
| 2016 | 7,129 | 4,864 | 3,299 | 2,122 | 2,004 | 1,499 | 1,424 | 1,576 | 1,619 | 1,878 | 2,879 | 6,770 |
| 2017 | 7,096 | 4,395 | 3,478 | 2,355 | 1,872 | 1,551 | 1,449 | 1,566 | 1,581 | 2,110 | 3,547 | 6,831 |
| 2018 | 8,504 | 7,165 | 4,462 | 3,716 | 1,827 | 1,578 | 1,462 | 1,577 | 1,618 | 2,481 | 5,523 | 7,047 |
| 2019 | 8,449 | 7,538 | 6,094 | 2,950 | 2,228 | 1,815 | 1,682 | 1,607 | 1,615 | 2,665 | 5,529 | 6,618 |
| 2020 | 7,188 | 6,855 | 4,287 | 2,776 | 1,897 | 1,541 | 1,521 | 1,542 | 1,742 | 2,531 | 3,826 | 6,695 |
| 2021 | 7,787 | 8,455 | 4,628 | 3,153 | 2,204 | 1,673 | 1,619 | 1,665 | 1,748 | 2,219 | 3,967 | 4,715 |
| 2022 | 7,998 | 7,431 | 5,078 | 2,861 | 2,053 | 1,549 | 1,476 | 1,544 | 1,600 | 2,277 | 4,615 | 6,834 |
| 2023 | 6,979 | 6,082 | 5,166 | 2,970 | 1,986 | 1,628 | 1,552 | 1,627 | 1,579 | 2,499 | 3,800 | 5,851 |
| 2024 | 9,374 | |||||||||||
| - = No Data Reported; -- = Not Applicable; NA = Not Available; W = Withheld to avoid disclosure of individual company data. |
| Release Date: 3/29/2024 |
| Next Release Date: 4/30/2024 |