|
Download Data (XLS File) |
|
||||||||
|
||||||||
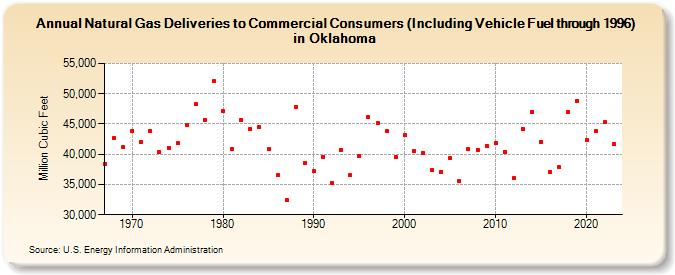
| Natural Gas Deliveries to Commercial Consumers (Including Vehicle Fuel through 1996) in Oklahoma (Million Cubic Feet) | ||||||||
| Decade | Year-0 | Year-1 | Year-2 | Year-3 | Year-4 | Year-5 | Year-6 | Year-7 | Year-8 | Year-9 |
|---|---|---|---|---|---|---|---|---|---|---|
| 1960's | 38,459 | 42,751 | 41,151 | |||||||
| 1970's | 43,921 | 41,978 | 43,852 | 40,403 | 41,074 | 41,806 | 44,862 | 48,253 | 45,729 | 52,036 |
| 1980's | 47,135 | 40,833 | 45,664 | 44,177 | 44,423 | 40,791 | 36,517 | 32,428 | 47,870 | 38,509 |
| 1990's | 37,208 | 39,588 | 35,190 | 40,766 | 36,504 | 39,639 | 46,152 | 45,086 | 43,800 | 39,565 |
| 2000's | 43,125 | 40,558 | 40,229 | 37,472 | 37,103 | 39,359 | 35,492 | 40,846 | 40,772 | 41,421 |
| 2010's | 41,822 | 40,393 | 36,106 | 44,238 | 47,041 | 41,982 | 37,064 | 37,833 | 46,960 | 48,791 |
| 2020's | 42,400 | 43,835 | 45,316 | 41,718 |
| - = No Data Reported; -- = Not Applicable; NA = Not Available; W = Withheld to avoid disclosure of individual company data. |
| Release Date: 3/29/2024 |
| Next Release Date: 4/30/2024 |