|
Download Data (XLS File) |
|
||||||||
|
||||||||
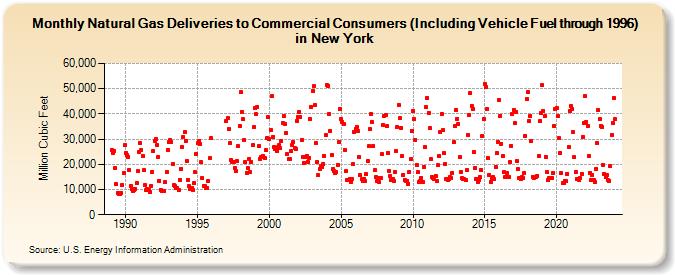
| Natural Gas Deliveries to Commercial Consumers (Including Vehicle Fuel through 1996) in New York (Million Cubic Feet) | ||||||||
| Year | Jan | Feb | Mar | Apr | May | Jun | Jul | Aug | Sep | Oct | Nov | Dec |
|---|---|---|---|---|---|---|---|---|---|---|---|---|
| 1989 | 25,565 | 24,630 | 25,344 | 18,494 | 12,079 | 8,747 | 8,382 | 8,305 | 8,812 | 11,741 | 16,631 | 27,650 |
| 1990 | 24,659 | 23,697 | 22,939 | 17,706 | 11,586 | 10,272 | 9,602 | 9,683 | 10,261 | 12,661 | 17,210 | 24,715 |
| 1991 | 28,442 | 25,685 | 23,462 | 17,684 | 11,669 | 9,641 | 10,331 | 9,764 | 9,195 | 11,571 | 17,033 | 25,121 |
| 1992 | 29,246 | 29,912 | 27,748 | 23,039 | 13,518 | 9,915 | 9,327 | 9,456 | 9,582 | 12,860 | 16,804 | 25,808 |
| 1993 | 28,857 | 29,740 | 28,926 | 20,266 | 11,667 | 11,221 | 10,477 | 10,502 | 9,972 | 13,970 | 18,205 | 26,928 |
| 1994 | 31,014 | 32,757 | 29,376 | 21,207 | 13,641 | 11,207 | 10,158 | 10,485 | 10,002 | 12,399 | 16,783 | 24,226 |
| 1995 | 28,329 | 29,345 | 28,182 | 20,813 | 14,459 | 11,501 | 11,281 | 10,797 | 10,619 | 13,394 | 22,325 | 30,309 |
| 1996 | NA | NA | NA | NA | NA | NA | NA | NA | NA | NA | NA | NA |
| 1997 | 37,271 | 38,333 | 33,984 | 28,292 | 21,731 | 20,911 | 21,088 | 18,546 | 17,280 | 21,116 | 27,091 | 35,221 |
| 1998 | 48,490 | 40,931 | 37,862 | 29,457 | 20,849 | 16,706 | 18,694 | 22,277 | 16,899 | 20,887 | 27,494 | 34,796 |
| 1999 | 42,261 | 39,821 | 42,746 | 27,116 | 22,226 | 22,852 | 22,751 | 23,324 | 22,448 | 25,595 | 30,457 | 38,589 |
| 2000 | 29,867 | 33,580 | 47,097 | 30,999 | 26,831 | 25,888 | 25,378 | 26,687 | 27,520 | 26,421 | 29,217 | 36,393 |
| 2001 | 39,080 | 36,148 | 32,399 | 23,895 | 22,097 | 22,083 | 25,103 | 27,552 | 28,804 | 26,630 | 26,198 | 37,264 |
| 2002 | 38,849 | 40,947 | 38,668 | 29,786 | 22,858 | 20,638 | 22,775 | 23,435 | 21,051 | 22,574 | 37,932 | 42,734 |
| 2003 | 49,079 | 50,889 | 43,424 | 28,289 | 20,885 | 15,587 | 18,055 | 19,414 | 18,801 | 20,203 | 23,236 | 31,509 |
| 2004 | 51,591 | 51,228 | 40,002 | 33,308 | 23,756 | 18,052 | 17,228 | 16,525 | 16,857 | 19,725 | 28,687 | 42,112 |
| 2005 | 38,121 | 36,856 | 35,813 | 25,636 | 17,221 | 13,786 | 13,716 | 14,300 | 13,017 | 14,291 | 19,998 | 32,967 |
| 2006 | 33,973 | 34,766 | 33,172 | 22,952 | 15,611 | 13,993 | 13,473 | 14,311 | 13,414 | 15,998 | 21,187 | 27,122 |
| 2007 | 33,952 | 40,031 | 36,681 | 27,104 | 17,604 | 14,901 | 13,436 | 14,394 | 12,833 | 14,554 | 23,969 | 35,570 |
| 2008 | 39,321 | 39,418 | 35,076 | 24,681 | 17,434 | 15,435 | 13,884 | 14,186 | 13,531 | 17,140 | 25,162 | 34,881 |
| 2009 | 43,676 | 38,205 | 34,522 | 23,100 | 15,922 | 13,691 | 13,438 | 13,504 | 12,376 | 17,137 | 22,003 | 33,188 |
| 2010 | 41,229 | 37,805 | 29,741 | 19,732 | 16,808 | 12,885 | 13,292 | 14,581 | 12,956 | 19,091 | 26,722 | 42,547 |
| 2011 | 46,338 | 40,453 | 34,280 | 21,989 | 15,108 | 14,510 | 14,139 | 15,299 | 13,299 | 19,619 | 23,187 | 32,898 |
| 2012 | 39,990 | 33,413 | 24,442 | 20,064 | 14,138 | 13,780 | 14,092 | 14,852 | 14,728 | 16,698 | 28,819 | 35,217 |
| 2013 | 41,481 | 38,147 | 36,128 | 22,709 | 16,842 | 14,397 | 14,259 | 14,178 | 13,636 | 17,608 | 31,697 | 39,694 |
| 2014 | 48,196 | 43,304 | 41,932 | 25,033 | 18,591 | 14,274 | 12,988 | 13,881 | 14,941 | 17,824 | 31,373 | 37,830 |
| 2015 | 51,813 | 50,726 | 41,824 | 22,349 | 15,674 | 13,026 | 14,458 | 14,826 | 14,008 | 19,000 | 24,517 | 28,987 |
| 2016 | 45,539 | 39,285 | 28,203 | 23,284 | 16,834 | 14,898 | 15,036 | 16,361 | 14,980 | 20,743 | 27,357 | 40,052 |
| 2017 | 41,616 | 36,320 | 40,896 | 21,293 | 18,003 | 14,482 | 14,117 | 14,857 | 14,706 | 16,696 | 31,367 | 45,967 |
| 2018 | 48,575 | 37,166 | 39,340 | 29,197 | 14,963 | 14,584 | 15,045 | 15,077 | 15,504 | 23,421 | 37,037 | 40,303 |
| 2019 | 51,352 | 41,248 | 39,125 | 22,903 | 16,836 | 13,665 | 14,673 | 14,698 | 14,663 | 16,506 | 35,283 | 41,826 |
| 2020 | 42,286 | 39,264 | 30,249 | 24,545 | 16,595 | 12,542 | 12,626 | 13,254 | 13,227 | 16,318 | 26,812 | 41,197 |
| 2021 | 43,052 | 41,896 | 32,623 | 22,755 | 17,033 | 14,230 | 14,366 | 13,858 | 14,493 | 16,316 | 30,934 | 36,244 |
| 2022 | 47,057 | 36,922 | 35,296 | 23,318 | 16,734 | 13,819 | 15,735 | 13,944 | 12,824 | 18,246 | 28,508 | 41,467 |
| 2023 | 37,822 | 35,258 | 34,998 | 19,828 | 16,230 | 14,807 | 15,750 | 13,804 | 13,523 | 19,229 | 31,633 | 36,488 |
| 2024 | 46,241 | |||||||||||
| - = No Data Reported; -- = Not Applicable; NA = Not Available; W = Withheld to avoid disclosure of individual company data. |
| Release Date: 3/29/2024 |
| Next Release Date: 4/30/2024 |