|
Download Data (XLS File) |
|
||||||||
|
||||||||
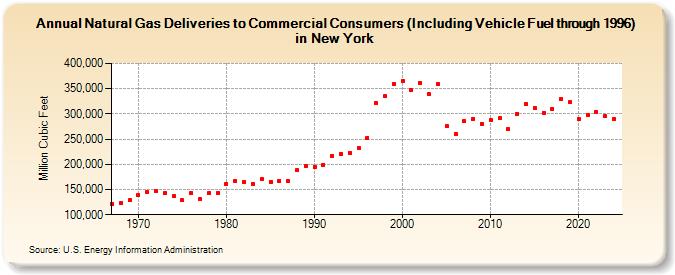
| Natural Gas Deliveries to Commercial Consumers (Including Vehicle Fuel through 1996) in New York (Million Cubic Feet) | ||||||||
| Decade | Year-0 | Year-1 | Year-2 | Year-3 | Year-4 | Year-5 | Year-6 | Year-7 | Year-8 | Year-9 |
|---|---|---|---|---|---|---|---|---|---|---|
| 1960's | 122,050 | 122,885 | 128,282 | |||||||
| 1970's | 139,498 | 145,458 | 147,326 | 142,736 | 136,332 | 128,273 | 143,530 | 130,898 | 142,988 | 143,512 |
| 1980's | 161,813 | 167,253 | 164,784 | 161,770 | 170,365 | 165,498 | 167,503 | 167,178 | 188,037 | 196,380 |
| 1990's | 194,990 | 199,598 | 217,214 | 220,729 | 223,256 | 231,352 | 253,075 | 320,862 | 335,343 | 360,188 |
| 2000's | 365,879 | 347,253 | 362,247 | 339,371 | 359,070 | 275,721 | 259,972 | 285,030 | 290,150 | 280,763 |
| 2010's | 287,389 | 291,118 | 270,232 | 300,776 | 320,168 | 311,207 | 302,572 | 310,319 | 330,213 | 322,778 |
| 2020's | 288,916 | 297,800 | 303,870 | 289,370 |
| - = No Data Reported; -- = Not Applicable; NA = Not Available; W = Withheld to avoid disclosure of individual company data. |
| Release Date: 3/29/2024 |
| Next Release Date: 4/30/2024 |