|
Download Data (XLS File) |
|
||||||||
|
||||||||
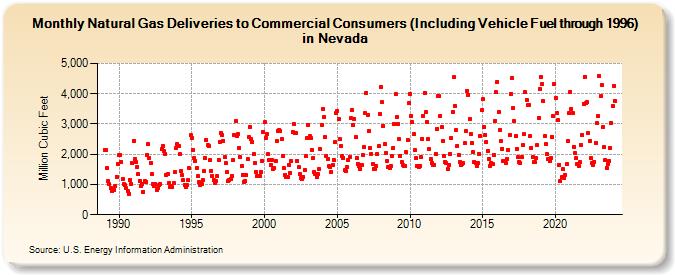
| Natural Gas Deliveries to Commercial Consumers (Including Vehicle Fuel through 1996) in Nevada (Million Cubic Feet) | ||||||||
| Year | Jan | Feb | Mar | Apr | May | Jun | Jul | Aug | Sep | Oct | Nov | Dec |
|---|---|---|---|---|---|---|---|---|---|---|---|---|
| 1989 | 2,156 | 2,125 | 1,533 | 1,100 | 1,004 | 890 | 790 | 805 | 811 | 954 | 1,257 | 1,690 |
| 1990 | 1,959 | 1,963 | 1,740 | 1,185 | 1,006 | 970 | 879 | 782 | 701 | 1,157 | 1,026 | 1,705 |
| 1991 | 2,447 | 1,839 | 1,739 | 1,593 | 1,333 | 1,121 | 947 | 1,005 | 761 | 1,104 | 1,095 | 1,976 |
| 1992 | 2,327 | 1,873 | 1,725 | 1,335 | 1,012 | 945 | 1,015 | 824 | 872 | 982 | 1,022 | 2,170 |
| 1993 | 2,271 | 2,110 | 2,016 | 1,314 | 1,341 | 1,052 | 919 | 939 | 909 | 1,047 | 1,421 | 2,211 |
| 1994 | 2,334 | 2,277 | 1,995 | 1,456 | 1,300 | 1,136 | 995 | 909 | 978 | 1,146 | 1,541 | 2,625 |
| 1995 | 2,551 | 2,139 | 1,868 | 1,784 | 1,558 | 1,268 | 1,082 | 978 | 1,009 | 1,151 | 1,444 | 1,871 |
| 1996 | 2,466 | 2,309 | 2,268 | 1,811 | 1,454 | 1,286 | 1,145 | 1,062 | 1,116 | 1,269 | 1,817 | 2,417 |
| 1997 | 2,717 | 2,634 | 2,447 | 1,900 | 1,695 | 1,412 | 1,099 | 1,148 | 1,195 | 1,273 | 1,800 | 2,638 |
| 1998 | 3,105 | 2,595 | 2,667 | 2,213 | 1,898 | 1,605 | 1,323 | 1,071 | 1,110 | 1,307 | 1,855 | 2,565 |
| 1999 | 2,916 | 2,501 | 2,389 | 1,995 | 1,721 | 1,419 | 1,269 | 1,267 | 1,288 | 1,423 | 1,791 | 2,732 |
| 2000 | 3,050 | 2,544 | 2,662 | 2,003 | 1,802 | 1,656 | 1,825 | 1,526 | 1,542 | 1,775 | 2,431 | 2,771 |
| 2001 | 2,816 | 2,775 | 2,510 | 1,940 | 1,528 | 1,325 | 1,237 | 1,238 | 1,655 | 1,383 | 1,774 | 2,731 |
| 2002 | 2,998 | 2,713 | 2,705 | 1,782 | 1,562 | 1,361 | 1,203 | 1,185 | 1,249 | 1,478 | 1,926 | 2,524 |
| 2003 | 2,967 | 2,588 | 2,532 | 2,151 | 1,879 | 1,415 | 1,355 | 1,231 | 1,334 | 1,511 | 2,170 | 2,967 |
| 2004 | 3,503 | 3,236 | 2,560 | 1,933 | 1,827 | 1,602 | 1,562 | 1,426 | 1,648 | 1,816 | 2,391 | 3,358 |
| 2005 | 3,435 | 3,152 | 2,510 | 2,274 | 1,927 | 1,891 | 1,466 | 1,441 | 1,564 | 1,799 | 1,905 | 3,187 |
| 2006 | 3,455 | 2,966 | 3,168 | 2,565 | 1,867 | 1,683 | 1,604 | 1,509 | 1,660 | 1,983 | 2,234 | 3,351 |
| 2007 | 4,034 | 3,306 | 2,760 | 2,200 | 2,021 | 1,679 | 1,527 | 1,497 | 1,604 | 2,007 | 2,262 | 3,328 |
| 2008 | 4,223 | 3,718 | 2,942 | 2,340 | 2,034 | 1,778 | 1,569 | 1,529 | 1,627 | 1,937 | 2,221 | 3,001 |
| 2009 | 3,980 | 3,230 | 3,007 | 2,503 | 1,951 | 1,747 | 1,651 | 1,621 | 1,624 | 2,059 | 2,480 | 3,679 |
| 2010 | 4,002 | 3,256 | 3,053 | 2,664 | 2,128 | 1,860 | 1,613 | 1,585 | 1,625 | 1,893 | 2,518 | 3,278 |
| 2011 | 4,017 | 3,380 | 3,059 | 2,503 | 2,162 | 1,830 | 1,723 | 1,640 | 1,654 | 2,019 | 2,838 | 3,939 |
| 2012 | 3,913 | 3,266 | 2,888 | 2,435 | 1,926 | 1,743 | 1,701 | 1,503 | 1,657 | 2,009 | 2,538 | 3,411 |
| 2013 | 4,542 | 3,594 | 2,804 | 2,284 | 1,987 | 1,746 | 1,655 | 1,668 | 1,699 | 2,362 | 2,767 | 4,103 |
| 2014 | 3,961 | 3,169 | 2,674 | 2,375 | 2,061 | 1,753 | 1,722 | 1,611 | 1,714 | 2,009 | 2,598 | 3,459 |
| 2015 | 3,817 | 2,902 | 2,642 | 2,411 | 2,119 | 1,839 | 1,610 | 1,722 | 1,674 | 1,977 | 3,114 | 4,045 |
| 2016 | 4,404 | 3,408 | 2,801 | 2,421 | 2,183 | 1,783 | 1,771 | 1,723 | 1,836 | 2,154 | 2,639 | 4,003 |
| 2017 | 4,528 | 3,525 | 3,089 | 2,596 | 2,189 | 1,908 | 1,758 | 1,704 | 1,902 | 2,300 | 2,658 | 4,043 |
| 2018 | 3,797 | 3,626 | 3,629 | 2,593 | 2,219 | 1,916 | 1,739 | 1,733 | 1,873 | 2,290 | 3,191 | 4,165 |
| 2019 | 4,553 | 4,323 | 3,745 | 2,588 | 2,331 | 1,994 | 1,839 | 1,783 | 1,876 | 2,583 | 3,249 | 4,326 |
| 2020 | 3,875 | 3,350 | 3,116 | 1,659 | 1,106 | 1,240 | 1,496 | 1,223 | 1,326 | 1,661 | 2,434 | 3,351 |
| 2021 | 4,056 | 3,501 | 3,376 | 2,250 | 2,034 | 1,859 | 1,690 | 1,610 | 1,733 | 2,319 | 2,637 | 3,674 |
| 2022 | 4,563 | 3,687 | 3,711 | 2,708 | 2,438 | 1,872 | 1,702 | 1,657 | 1,752 | 2,382 | 3,030 | 3,263 |
| 2023 | 4,578 | 3,931 | 4,287 | 2,903 | 2,238 | 1,795 | 1,556 | 1,661 | 1,781 | 2,221 | 3,047 | 3,605 |
| 2024 | 4,272 | |||||||||||
| - = No Data Reported; -- = Not Applicable; NA = Not Available; W = Withheld to avoid disclosure of individual company data. |
| Release Date: 3/29/2024 |
| Next Release Date: 4/30/2024 |