|
Download Data (XLS File) |
|
||||||||
|
||||||||
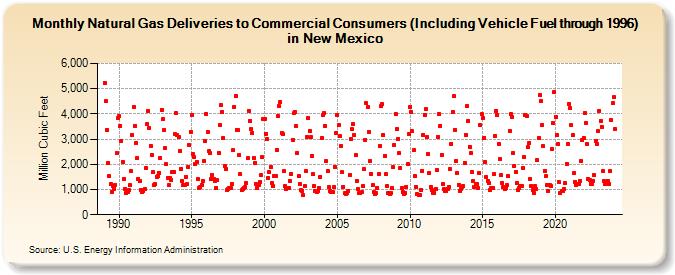
| Natural Gas Deliveries to Commercial Consumers (Including Vehicle Fuel through 1996) in New Mexico (Million Cubic Feet) | ||||||||
| Year | Jan | Feb | Mar | Apr | May | Jun | Jul | Aug | Sep | Oct | Nov | Dec |
|---|---|---|---|---|---|---|---|---|---|---|---|---|
| 1989 | 5,242 | 4,499 | 3,377 | 2,059 | 1,517 | 1,211 | 913 | 1,146 | 1,034 | 1,191 | 2,441 | 3,830 |
| 1990 | 3,903 | 3,537 | 2,944 | 2,078 | 1,434 | 1,027 | 853 | 889 | 974 | 1,168 | 1,729 | 3,159 |
| 1991 | 4,292 | 3,537 | 2,855 | 2,246 | 1,435 | 1,327 | 998 | 886 | 934 | 1,034 | 1,861 | 3,586 |
| 1992 | 4,118 | 3,445 | 2,730 | 2,372 | 1,687 | 1,171 | 1,200 | 1,513 | 1,541 | 1,673 | 2,269 | 4,165 |
| 1993 | 3,781 | 3,366 | 2,637 | 2,002 | 1,467 | 1,169 | 1,440 | 1,390 | 1,712 | 1,703 | 3,197 | 4,034 |
| 1994 | 3,157 | 3,076 | 2,519 | 1,825 | 1,338 | 1,178 | 1,194 | 1,513 | 1,202 | 1,912 | 2,754 | 3,296 |
| 1995 | 3,955 | 2,396 | 2,280 | 2,006 | 2,105 | 1,408 | 1,073 | 1,119 | 1,193 | 1,330 | 2,149 | 2,920 |
| 1996 | 4,002 | 3,291 | 2,509 | 2,433 | 1,410 | 1,592 | 1,429 | 1,352 | 1,079 | 1,365 | 2,450 | 3,553 |
| 1997 | 4,333 | 4,090 | 3,044 | 1,915 | 1,819 | 988 | 1,035 | 1,052 | 1,071 | 1,222 | 2,549 | 4,286 |
| 1998 | 4,711 | 3,377 | 3,357 | 2,384 | 1,603 | 963 | 1,039 | 1,073 | 1,090 | 1,249 | 2,233 | 4,125 |
| 1999 | 3,737 | 3,389 | 3,253 | 2,268 | 2,045 | 1,218 | 1,063 | 1,180 | 1,297 | 1,560 | 2,277 | 3,816 |
| 2000 | 3,806 | 3,220 | 2,996 | 1,471 | 1,683 | 1,890 | 1,260 | 1,127 | 1,540 | 1,536 | 2,568 | 3,910 |
| 2001 | 4,306 | 4,454 | 3,251 | 3,186 | 1,715 | 1,139 | 1,012 | 1,055 | 1,078 | 1,334 | 1,619 | 2,983 |
| 2002 | 4,024 | 4,085 | 3,519 | 2,448 | 1,524 | 1,220 | 967 | 960 | 764 | 1,133 | 1,734 | 3,098 |
| 2003 | 3,835 | 3,326 | 3,073 | 2,344 | 1,604 | 1,138 | 954 | 906 | 950 | 1,063 | 1,511 | 3,041 |
| 2004 | 3,960 | 4,027 | 3,524 | 2,121 | 1,740 | 1,086 | 937 | 894 | 907 | 1,098 | 1,912 | 3,251 |
| 2005 | 3,955 | 3,549 | 3,115 | 2,732 | 1,683 | 1,091 | 843 | 819 | 852 | 959 | 1,586 | 3,001 |
| 2006 | 3,388 | 3,595 | 3,156 | 2,368 | 1,348 | 1,003 | 864 | 860 | 898 | 1,126 | 1,819 | 2,980 |
| 2007 | 4,421 | 4,278 | 3,286 | 2,137 | 1,629 | 1,163 | 888 | 820 | 860 | 1,062 | 1,598 | 2,735 |
| 2008 | 4,299 | 4,389 | 3,172 | 2,338 | 1,600 | 1,139 | 856 | 832 | 858 | 1,061 | 1,882 | 2,756 |
| 2009 | 3,991 | 3,381 | 3,012 | 2,446 | 1,859 | 1,056 | 920 | 838 | 877 | 1,111 | 2,000 | 3,211 |
| 2010 | 4,287 | 4,083 | 3,309 | 2,548 | 1,524 | 1,112 | 807 | 779 | 791 | 999 | 1,753 | 3,162 |
| 2011 | 3,962 | 4,177 | 3,067 | 2,417 | 1,664 | 1,109 | 999 | 850 | 876 | 1,039 | 1,779 | 3,099 |
| 2012 | 3,991 | 3,535 | 2,381 | 1,229 | 1,019 | 924 | 955 | 1,033 | 1,110 | 1,815 | 2,825 | 4,081 |
| 2013 | 4,691 | 3,371 | 2,145 | 1,649 | 1,191 | 954 | 1,034 | 1,100 | 1,136 | 2,043 | 3,176 | 4,299 |
| 2014 | 3,737 | 2,702 | 2,429 | 1,703 | 1,324 | 1,118 | 1,200 | 1,224 | 1,060 | 1,652 | 3,555 | 3,990 |
| 2015 | 3,836 | 3,063 | 2,093 | 1,488 | 1,356 | 1,240 | 980 | 1,068 | 1,053 | 1,608 | 3,137 | 4,115 |
| 2016 | 3,942 | 2,815 | 2,196 | 1,558 | 1,249 | 1,117 | 1,009 | 1,053 | 1,170 | 1,534 | 3,332 | 3,981 |
| 2017 | 3,887 | 2,444 | 1,931 | 1,696 | 1,259 | 997 | 1,048 | 1,120 | 1,131 | 1,846 | 2,295 | 3,968 |
| 2018 | 3,908 | 2,678 | 2,829 | 1,433 | 1,143 | 1,000 | 867 | 1,122 | 1,031 | 2,153 | 3,036 | 4,748 |
| 2019 | 4,514 | 3,551 | 2,726 | 1,739 | 1,535 | 1,166 | 958 | 1,188 | 1,157 | 2,618 | 3,640 | 4,870 |
| 2020 | 3,889 | 3,171 | 2,813 | 1,280 | 865 | 937 | 944 | 1,026 | 1,250 | 2,024 | 2,813 | 4,396 |
| 2021 | 4,219 | 3,547 | 3,147 | 1,650 | 1,309 | 1,176 | 1,225 | 1,210 | 1,333 | 2,112 | 2,967 | 3,050 |
| 2022 | 4,049 | 3,648 | 2,804 | 1,423 | 1,372 | 1,235 | 1,209 | 1,345 | 1,571 | 2,939 | 2,825 | 3,304 |
| 2023 | 4,118 | 3,725 | 3,480 | 1,725 | 1,334 | 1,227 | 1,221 | 1,352 | 1,233 | 1,718 | 3,741 | 4,421 |
| 2024 | 4,666 | |||||||||||
| - = No Data Reported; -- = Not Applicable; NA = Not Available; W = Withheld to avoid disclosure of individual company data. |
| Release Date: 3/29/2024 |
| Next Release Date: 4/30/2024 |