|
Download Data (XLS File) |
|
||||||||
|
||||||||
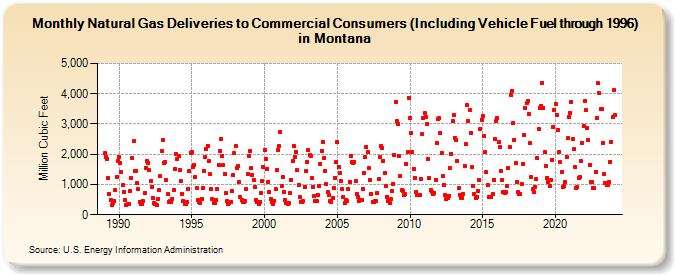
| Natural Gas Deliveries to Commercial Consumers (Including Vehicle Fuel through 1996) in Montana (Million Cubic Feet) | ||||||||
| Year | Jan | Feb | Mar | Apr | May | Jun | Jul | Aug | Sep | Oct | Nov | Dec |
|---|---|---|---|---|---|---|---|---|---|---|---|---|
| 1989 | 2,029 | 1,923 | 1,841 | 1,208 | 687 | 478 | 330 | 381 | 442 | 806 | 1,235 | 1,781 |
| 1990 | 1,912 | 1,705 | 1,402 | 998 | 766 | 487 | 323 | 348 | 347 | 782 | 1,206 | 1,889 |
| 1991 | 2,425 | 1,435 | 1,450 | 1,053 | 843 | 431 | 357 | 341 | 438 | 724 | 1,559 | 1,790 |
| 1992 | 1,726 | 1,464 | 1,099 | 930 | 568 | 377 | 365 | 331 | 523 | 810 | 1,271 | 2,095 |
| 1993 | 2,465 | 1,705 | 1,741 | 1,137 | 682 | 434 | 437 | 416 | 535 | 819 | 1,508 | 1,999 |
| 1994 | 1,844 | 1,936 | 1,465 | 1,100 | 699 | 452 | 362 | 348 | 423 | 860 | 1,447 | 2,043 |
| 1995 | 2,085 | 1,591 | 1,654 | 1,245 | 872 | 488 | 404 | 376 | 520 | 899 | 1,454 | 1,898 |
| 1996 | 2,188 | 2,281 | 1,763 | 1,332 | 862 | 509 | 386 | 374 | 498 | 848 | 1,659 | 2,123 |
| 1997 | 2,504 | 1,956 | 1,632 | 1,348 | 717 | 453 | 365 | 385 | 424 | 796 | 1,304 | 2,028 |
| 1998 | 2,267 | 1,534 | 1,605 | 1,089 | 589 | 481 | 424 | 415 | 439 | 845 | 1,340 | 1,925 |
| 1999 | 2,094 | 1,541 | 1,307 | 1,152 | 901 | 492 | 422 | 346 | 426 | 726 | 1,100 | 1,581 |
| 2000 | 2,145 | 1,834 | 1,521 | 1,098 | 736 | 511 | 433 | 359 | 459 | 835 | 1,471 | 2,131 |
| 2001 | 2,259 | 2,736 | 964 | 1,253 | 767 | 492 | 383 | 363 | 387 | 725 | 1,147 | 1,770 |
| 2002 | 2,274 | 1,910 | 2,087 | 1,463 | 983 | 588 | 428 | 415 | 443 | 919 | 1,441 | 1,753 |
| 2003 | 2,127 | 1,979 | 1,945 | 1,218 | 930 | 613 | 452 | 443 | 665 | 954 | 1,681 | 2,111 |
| 2004 | 2,410 | 1,883 | 1,454 | 1,015 | 737 | 647 | 456 | 423 | 543 | 879 | 1,227 | 1,735 |
| 2005 | 2,388 | 1,585 | 1,385 | 1,127 | 850 | 589 | 375 | 479 | 463 | 855 | 1,090 | 1,950 |
| 2006 | 1,742 | 1,718 | 1,743 | 1,105 | 695 | 581 | 469 | 491 | 494 | 844 | 1,395 | 1,904 |
| 2007 | 2,240 | 2,057 | 1,542 | 1,147 | 691 | 419 | 426 | 459 | 446 | 703 | 1,170 | 1,924 |
| 2008 | 2,262 | 2,208 | 1,792 | 1,372 | 949 | 596 | 464 | 391 | 511 | 792 | 1,031 | 1,971 |
| 2009 | 3,724 | 3,084 | 3,002 | 1,931 | 1,272 | 802 | 796 | 666 | 677 | 1,688 | 2,068 | 3,866 |
| 2010 | 3,182 | 2,702 | 2,072 | 1,526 | 1,220 | 764 | 645 | 637 | 663 | 1,197 | 2,659 | 3,193 |
| 2011 | 3,355 | 3,231 | 3,012 | 1,857 | 1,200 | 811 | 758 | 675 | 732 | 1,163 | 2,383 | 3,160 |
| 2012 | 3,189 | 2,711 | 2,051 | 1,290 | 997 | 646 | 508 | 537 | 632 | 1,542 | 2,019 | 3,082 |
| 2013 | 3,283 | 2,540 | 2,455 | 1,776 | 885 | 640 | 562 | 555 | 681 | 1,623 | 2,345 | 3,626 |
| 2014 | 3,113 | 3,468 | 2,715 | 1,562 | 959 | 671 | 542 | 580 | 793 | 1,154 | 2,849 | 3,145 |
| 2015 | 3,252 | 2,586 | 2,060 | 1,404 | 988 | 583 | 595 | 582 | 687 | 1,157 | 2,504 | 3,104 |
| 2016 | 3,184 | 2,390 | 2,230 | 1,461 | 1,136 | 764 | 732 | 742 | 934 | 1,556 | 2,238 | 3,947 |
| 2017 | 4,096 | 3,028 | 2,475 | 1,711 | 1,095 | 753 | 670 | 685 | 1,010 | 1,683 | 2,643 | 3,524 |
| 2018 | 3,685 | 3,758 | 3,344 | 2,355 | 1,245 | 843 | 749 | 928 | 1,171 | 1,861 | 2,825 | 3,542 |
| 2019 | 3,595 | 4,368 | 3,529 | 2,079 | 1,621 | 1,230 | 1,082 | 941 | 1,143 | 1,823 | 2,907 | 3,472 |
| 2020 | 3,660 | 3,306 | 2,802 | 2,080 | 1,734 | 1,405 | 920 | 949 | 1,066 | 1,917 | 2,525 | 3,234 |
| 2021 | 3,376 | 3,727 | 2,508 | 2,164 | 1,582 | 871 | 901 | 1,221 | 1,246 | 1,764 | 2,371 | 2,938 |
| 2022 | 3,745 | 3,450 | 2,853 | 2,467 | 1,659 | 1,092 | 1,077 | 896 | 876 | 1,398 | 3,213 | 4,340 |
| 2023 | 4,014 | 3,495 | 3,497 | 2,387 | 1,336 | 1,048 | 992 | 988 | 1,068 | 1,752 | 2,409 | 3,220 |
| 2024 | 4,137 | |||||||||||
| - = No Data Reported; -- = Not Applicable; NA = Not Available; W = Withheld to avoid disclosure of individual company data. |
| Release Date: 3/29/2024 |
| Next Release Date: 4/30/2024 |