|
Download Data (XLS File) |
|
||||||||
|
||||||||
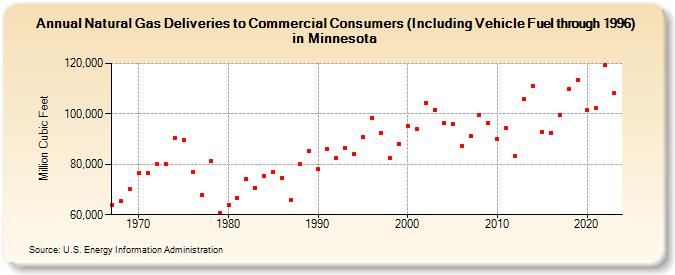
| Natural Gas Deliveries to Commercial Consumers (Including Vehicle Fuel through 1996) in Minnesota (Million Cubic Feet) | ||||||||
| Decade | Year-0 | Year-1 | Year-2 | Year-3 | Year-4 | Year-5 | Year-6 | Year-7 | Year-8 | Year-9 |
|---|---|---|---|---|---|---|---|---|---|---|
| 1960's | 63,740 | 65,536 | 70,232 | |||||||
| 1970's | 76,585 | 76,441 | 79,987 | 80,219 | 90,412 | 89,651 | 76,981 | 67,839 | 81,121 | 60,509 |
| 1980's | 63,780 | 66,755 | 74,309 | 70,713 | 75,175 | 77,020 | 74,478 | 65,923 | 79,989 | 85,183 |
| 1990's | 78,015 | 85,875 | 82,381 | 86,629 | 83,933 | 90,658 | 98,537 | 92,232 | 82,345 | 88,061 |
| 2000's | 95,358 | 93,844 | 104,387 | 101,446 | 96,541 | 95,916 | 87,170 | 91,275 | 99,526 | 96,218 |
| 2010's | 89,963 | 94,360 | 83,174 | 105,937 | 110,884 | 93,005 | 92,591 | 99,756 | 110,026 | 113,428 |
| 2020's | 101,515 | 102,194 | 119,447 | 108,120 |
| - = No Data Reported; -- = Not Applicable; NA = Not Available; W = Withheld to avoid disclosure of individual company data. |
| Release Date: 3/29/2024 |
| Next Release Date: 4/30/2024 |