|
Download Data (XLS File) |
|
||||||||
|
||||||||
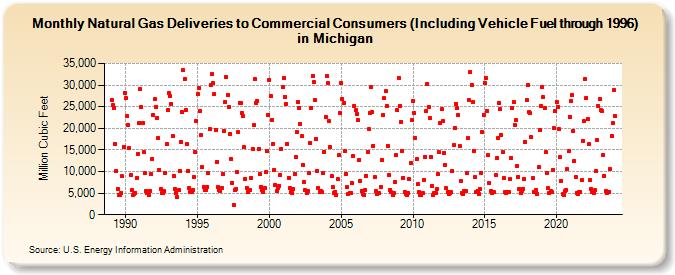
| Natural Gas Deliveries to Commercial Consumers (Including Vehicle Fuel through 1996) in Michigan (Million Cubic Feet) | ||||||||
| Year | Jan | Feb | Mar | Apr | May | Jun | Jul | Aug | Sep | Oct | Nov | Dec |
|---|---|---|---|---|---|---|---|---|---|---|---|---|
| 1989 | 26,553 | 25,448 | 24,717 | 16,375 | 10,150 | 5,954 | 4,570 | 4,467 | 5,047 | 8,855 | 15,776 | 28,269 |
| 1990 | 26,939 | 22,780 | 20,870 | 15,431 | 9,230 | 5,638 | 4,610 | 4,865 | 5,117 | 8,592 | 14,122 | 21,237 |
| 1991 | 29,054 | 24,902 | 21,321 | 14,617 | 9,583 | 5,601 | 4,916 | 4,508 | 5,510 | 9,450 | 12,966 | 23,131 |
| 1992 | 26,677 | 24,979 | 22,443 | 17,769 | 10,406 | 5,883 | 4,981 | 4,964 | 5,431 | 9,760 | 16,298 | 24,211 |
| 1993 | 28,122 | 27,427 | 25,623 | 18,238 | 9,009 | 5,968 | 5,035 | 4,140 | 5,767 | 10,193 | 16,875 | 23,833 |
| 1994 | 33,440 | 31,356 | 24,263 | 16,330 | 10,123 | 6,207 | 5,343 | 5,363 | 5,719 | 8,796 | 14,511 | 21,617 |
| 1995 | 27,945 | 29,223 | 23,980 | 18,384 | 11,004 | 6,372 | 5,664 | 5,778 | 6,417 | 9,647 | 19,742 | 29,922 |
| 1996 | 32,468 | 30,447 | 27,914 | 19,664 | 12,272 | 6,343 | 5,673 | 5,383 | 6,146 | 9,472 | 19,486 | 26,123 |
| 1997 | 31,844 | 27,773 | 25,030 | 18,732 | 12,841 | 7,416 | 2,213 | 5,687 | 5,996 | 9,789 | 19,043 | 25,893 |
| 1998 | 25,920 | 23,610 | 22,766 | 15,595 | 8,265 | 6,183 | 5,197 | 5,694 | 5,685 | 8,608 | 15,174 | 20,671 |
| 1999 | 31,374 | 25,759 | 26,308 | 15,237 | 9,355 | 6,485 | 5,785 | 5,339 | 6,161 | 9,792 | 14,639 | 23,119 |
| 2000 | 31,228 | 27,474 | 22,035 | 16,473 | 10,380 | 6,903 | 5,437 | 6,111 | 6,648 | 9,294 | 15,273 | 29,545 |
| 2001 | 31,736 | 27,202 | 25,688 | 16,415 | 8,564 | 6,076 | 5,147 | 5,108 | 5,943 | 9,463 | 13,255 | 19,137 |
| 2002 | 26,142 | 24,665 | 20,884 | 18,107 | 11,525 | 7,527 | 5,609 | 5,127 | 5,570 | 9,627 | 16,602 | 24,624 |
| 2003 | 32,096 | 30,665 | 26,592 | 17,614 | 10,215 | 6,163 | 5,336 | 5,488 | 5,160 | 9,556 | 14,617 | 22,627 |
| 2004 | 32,001 | 30,391 | 21,629 | 15,622 | 8,901 | 6,317 | 5,117 | 5,282 | 4,481 | 8,164 | 13,714 | 23,569 |
| 2005 | 30,588 | 26,773 | 25,853 | 14,650 | 9,496 | 6,319 | 4,890 | 4,914 | 5,133 | 7,306 | 13,510 | 25,192 |
| 2006 | 24,158 | 23,321 | 21,863 | 12,729 | 7,833 | 5,495 | 4,888 | 4,544 | 5,682 | 9,055 | 14,540 | 19,788 |
| 2007 | 23,485 | 29,539 | 23,711 | 15,975 | 8,707 | 5,399 | 4,766 | 4,914 | 4,941 | 6,521 | 12,762 | 23,019 |
| 2008 | 26,978 | 28,568 | 25,165 | 15,998 | 9,151 | 5,770 | 5,198 | 4,650 | 4,988 | 7,675 | 13,803 | 24,164 |
| 2009 | 31,741 | 25,241 | 21,465 | 14,791 | 8,513 | 5,333 | 4,749 | 4,642 | 5,084 | 8,241 | 11,970 | 21,913 |
| 2010 | 26,263 | 23,573 | 17,769 | 12,856 | 7,086 | 5,205 | 4,571 | 4,486 | 5,046 | 8,094 | 13,430 | 23,969 |
| 2011 | 30,252 | 25,020 | 22,361 | 13,421 | 6,752 | 4,569 | 5,128 | 5,104 | 5,896 | 9,362 | 14,399 | 21,304 |
| 2012 | 24,398 | 21,674 | 14,288 | 11,523 | 6,100 | 5,158 | 4,865 | 5,021 | 5,214 | 10,101 | 16,172 | 20,094 |
| 2013 | 25,684 | 24,686 | 23,112 | 15,817 | 7,693 | 5,012 | 4,879 | 5,374 | 5,585 | 9,539 | 17,643 | 26,493 |
| 2014 | 33,083 | 30,115 | 26,042 | 14,841 | 8,664 | 5,304 | 5,589 | 4,894 | 5,871 | 9,681 | 19,200 | 23,128 |
| 2015 | 30,587 | 31,717 | 23,965 | 13,744 | 7,299 | 5,423 | 5,034 | 5,372 | 5,182 | 9,169 | 13,062 | 17,807 |
| 2016 | 25,886 | 24,382 | 18,468 | 14,403 | 8,584 | 5,237 | 5,030 | 5,186 | 5,363 | 8,229 | 13,187 | 24,658 |
| 2017 | 26,046 | 20,747 | 21,858 | 11,198 | 8,794 | 5,967 | 5,046 | 5,410 | 5,954 | 8,274 | 16,897 | 26,443 |
| 2018 | 30,008 | 23,818 | 23,451 | 17,926 | 8,384 | 5,272 | 5,171 | 5,758 | 4,896 | 10,983 | 19,513 | 25,154 |
| 2019 | 29,516 | 27,193 | 24,748 | 14,439 | 9,670 | 6,101 | 4,922 | 5,502 | 5,222 | 10,427 | 20,007 | 24,076 |
| 2020 | 26,095 | 25,029 | 19,745 | 13,332 | 7,887 | 4,725 | 4,509 | 5,462 | 5,817 | 10,504 | 14,656 | 22,726 |
| 2021 | 26,213 | 27,645 | 19,438 | 12,373 | 8,678 | 5,102 | 4,748 | 5,300 | 5,201 | 7,955 | 17,074 | 21,671 |
| 2022 | 31,353 | 27,122 | 22,131 | 16,307 | 8,032 | 5,984 | 5,270 | 4,925 | 5,664 | 10,049 | 17,309 | 25,129 |
| 2023 | 26,669 | 24,182 | 23,907 | 13,894 | 8,930 | 5,547 | 5,061 | 5,308 | 5,333 | 10,569 | 18,236 | 21,186 |
| 2024 | 28,896 | |||||||||||
| - = No Data Reported; -- = Not Applicable; NA = Not Available; W = Withheld to avoid disclosure of individual company data. |
| Release Date: 3/29/2024 |
| Next Release Date: 4/30/2024 |