|
Download Data (XLS File) |
|
||||||||
|
||||||||
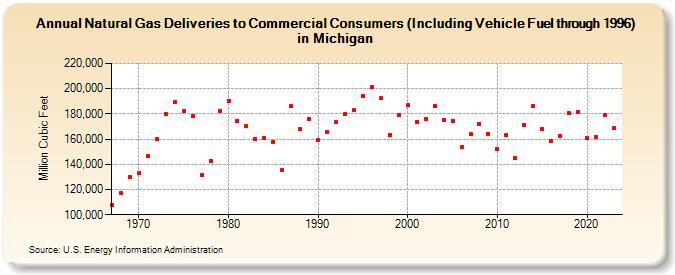
| Natural Gas Deliveries to Commercial Consumers (Including Vehicle Fuel through 1996) in Michigan (Million Cubic Feet) | ||||||||
| Decade | Year-0 | Year-1 | Year-2 | Year-3 | Year-4 | Year-5 | Year-6 | Year-7 | Year-8 | Year-9 |
|---|---|---|---|---|---|---|---|---|---|---|
| 1960's | 107,796 | 117,124 | 130,062 | |||||||
| 1970's | 132,708 | 146,217 | 159,970 | 180,274 | 189,192 | 181,949 | 178,220 | 131,266 | 142,935 | 182,316 |
| 1980's | 190,268 | 174,722 | 170,269 | 159,916 | 160,952 | 157,758 | 135,592 | 185,956 | 167,900 | 176,182 |
| 1990's | 159,429 | 165,558 | 173,802 | 180,230 | 183,068 | 194,078 | 201,390 | 192,258 | 163,368 | 179,351 |
| 2000's | 186,800 | 173,734 | 176,010 | 186,129 | 175,190 | 174,625 | 153,896 | 163,740 | 172,108 | 163,683 |
| 2010's | 152,350 | 163,567 | 144,609 | 171,519 | 186,413 | 168,360 | 158,613 | 162,634 | 180,333 | 181,825 |
| 2020's | 160,487 | 161,399 | 179,274 | 168,821 |
| - = No Data Reported; -- = Not Applicable; NA = Not Available; W = Withheld to avoid disclosure of individual company data. |
| Release Date: 3/29/2024 |
| Next Release Date: 4/30/2024 |