|
Download Data (XLS File) |
|
||||||||
|
||||||||
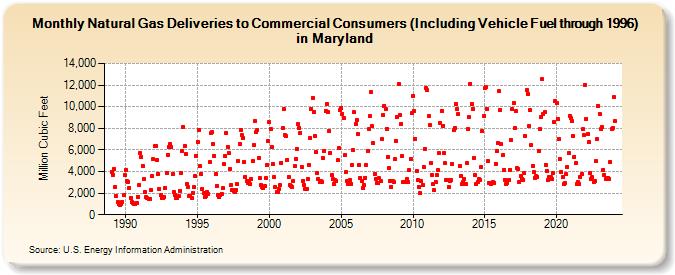
| Natural Gas Deliveries to Commercial Consumers (Including Vehicle Fuel through 1996) in Maryland (Million Cubic Feet) | ||||||||
| Year | Jan | Feb | Mar | Apr | May | Jun | Jul | Aug | Sep | Oct | Nov | Dec |
|---|---|---|---|---|---|---|---|---|---|---|---|---|
| 1989 | 3,976 | 3,700 | 4,247 | 2,586 | 1,701 | 1,154 | 968 | 941 | 978 | 1,220 | 1,801 | 3,647 |
| 1990 | 4,168 | 3,115 | 3,057 | 2,477 | 1,557 | 1,131 | 1,049 | 961 | 1,016 | 1,095 | 1,686 | 2,738 |
| 1991 | 5,709 | 5,334 | 4,545 | 3,320 | 2,108 | 1,602 | 1,545 | 1,465 | 1,486 | 2,289 | 3,582 | 5,132 |
| 1992 | 6,323 | 6,382 | 5,073 | 3,807 | 2,391 | 1,784 | 1,553 | 1,586 | 1,615 | 2,491 | 3,895 | 5,565 |
| 1993 | 6,273 | 6,568 | 6,232 | 3,772 | 2,110 | 1,861 | 1,507 | 1,567 | 1,700 | 2,231 | 3,898 | 5,915 |
| 1994 | 8,122 | 6,354 | 5,634 | 2,844 | 2,547 | 1,709 | 1,732 | 1,588 | 2,016 | 2,531 | 3,582 | 5,475 |
| 1995 | 6,743 | 7,826 | 4,472 | 3,736 | 2,388 | 1,994 | 1,612 | 1,722 | 2,065 | 1,907 | 4,871 | 7,538 |
| 1996 | 7,648 | 6,515 | 5,476 | 3,766 | 2,672 | 1,816 | 1,608 | 1,866 | 1,922 | 2,427 | 4,693 | 5,433 |
| 1997 | 7,593 | 6,282 | 5,673 | 4,235 | 2,741 | 2,313 | 2,235 | 2,069 | 2,281 | 2,836 | 4,957 | 6,587 |
| 1998 | 7,873 | 7,358 | 7,138 | 4,897 | 3,478 | 3,126 | 2,933 | 3,085 | 2,832 | 3,287 | 4,928 | 6,433 |
| 1999 | 8,688 | 7,678 | 7,857 | 5,260 | 3,380 | 2,713 | 2,559 | 2,496 | 2,664 | 3,358 | 4,630 | 6,818 |
| 2000 | 8,579 | 7,962 | 6,224 | 4,673 | 3,498 | 2,587 | 2,077 | 2,070 | 2,392 | 2,747 | 4,816 | 8,042 |
| 2001 | 9,749 | 7,337 | 7,271 | 5,073 | 3,495 | 2,753 | 2,641 | 2,591 | 3,118 | 4,473 | 5,197 | 6,102 |
| 2002 | 8,356 | 8,024 | 7,598 | 4,423 | 3,149 | 2,760 | 2,425 | 2,373 | 3,324 | 4,619 | 7,122 | 9,825 |
| 2003 | 10,833 | 9,514 | 7,277 | 5,794 | 3,869 | 3,283 | 3,049 | 3,111 | 3,063 | 5,235 | 5,943 | 9,586 |
| 2004 | 10,264 | 9,529 | 7,728 | 5,715 | 3,634 | 3,291 | 2,878 | 3,203 | 3,122 | 5,029 | 6,135 | 9,669 |
| 2005 | 9,894 | 9,353 | 8,908 | 5,512 | 3,917 | 3,140 | 2,875 | 3,197 | 2,878 | 4,612 | 5,961 | 9,472 |
| 2006 | 8,362 | 8,780 | 7,460 | 4,621 | 3,440 | 3,084 | 2,479 | 2,784 | 3,434 | 4,622 | 5,868 | 7,932 |
| 2007 | 9,108 | 11,321 | 8,178 | 6,600 | 3,761 | 3,324 | 2,928 | 2,912 | 3,372 | 3,097 | 7,004 | 9,247 |
| 2008 | 10,108 | 9,802 | 7,971 | 5,367 | 4,348 | 3,084 | 2,577 | 3,109 | 3,009 | 5,127 | 6,848 | 9,061 |
| 2009 | 12,106 | 9,204 | 8,354 | 5,421 | 3,018 | 3,022 | 2,993 | 3,283 | 3,042 | 4,118 | 5,185 | 9,373 |
| 2010 | 11,003 | 9,569 | 7,048 | 4,025 | 3,208 | 2,596 | 1,982 | 3,088 | 2,787 | 4,419 | 6,063 | 11,768 |
| 2011 | 11,518 | 9,107 | 8,272 | 4,797 | 3,702 | 2,800 | 2,267 | 3,065 | 3,692 | 4,128 | 5,683 | 8,473 |
| 2012 | 9,640 | 8,256 | 5,684 | 4,761 | 3,229 | 3,237 | 2,539 | 3,102 | 3,177 | 4,691 | 7,801 | 8,029 |
| 2013 | 10,206 | 9,754 | 9,327 | 4,550 | 3,564 | 2,862 | 3,007 | 3,263 | 2,841 | 4,808 | 7,934 | 9,028 |
| 2014 | 12,140 | 10,237 | 9,792 | 5,278 | 3,690 | 2,862 | 3,043 | 3,303 | 3,228 | 4,436 | 7,736 | 9,099 |
| 2015 | 11,699 | 11,814 | 9,783 | 4,954 | 2,956 | 2,840 | 2,943 | 2,986 | 2,962 | 4,720 | 5,903 | 6,638 |
| 2016 | 11,424 | 9,691 | 6,514 | 5,514 | 4,159 | 3,249 | 2,883 | 2,978 | 3,228 | 4,184 | 6,916 | 9,758 |
| 2017 | 10,354 | 8,026 | 9,620 | 4,287 | 4,222 | 3,035 | 3,544 | 3,266 | 3,251 | 3,865 | 7,296 | 11,513 |
| 2018 | 11,205 | 8,194 | 9,651 | 6,408 | 4,495 | 3,924 | 3,417 | 3,586 | 3,525 | 5,938 | 7,923 | 9,043 |
| 2019 | 12,519 | 9,295 | 9,472 | 4,623 | 4,074 | 3,226 | 3,456 | 3,458 | 3,341 | 3,816 | 8,572 | 10,496 |
| 2020 | 10,298 | 8,899 | 6,987 | 5,167 | 3,986 | 3,447 | 2,832 | 2,903 | 3,744 | 4,436 | 5,697 | 9,165 |
| 2021 | 8,916 | 8,643 | 7,290 | 5,343 | 4,757 | 2,854 | 3,043 | 2,877 | 3,495 | 3,731 | 7,901 | 7,352 |
| 2022 | 12,023 | 8,899 | 7,490 | 6,709 | 3,843 | 3,314 | 3,449 | 3,032 | 3,114 | 4,950 | 7,015 | 10,078 |
| 2023 | 9,332 | 7,929 | 8,100 | 4,158 | 3,717 | 3,307 | 3,424 | 3,426 | 3,308 | 4,909 | 7,960 | 8,047 |
| 2024 | 10,866 | |||||||||||
| - = No Data Reported; -- = Not Applicable; NA = Not Available; W = Withheld to avoid disclosure of individual company data. |
| Release Date: 3/29/2024 |
| Next Release Date: 4/30/2024 |