|
Download Data (XLS File) |
|
||||||||
|
||||||||
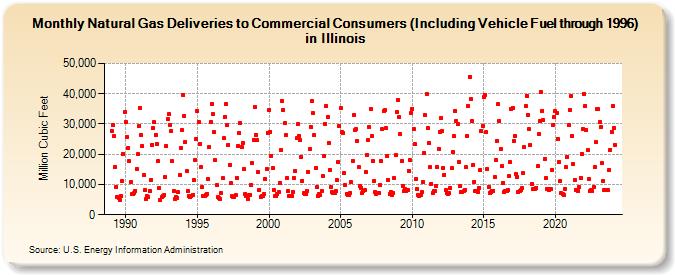
| Natural Gas Deliveries to Commercial Consumers (Including Vehicle Fuel through 1996) in Illinois (Million Cubic Feet) | ||||||||
| Year | Jan | Feb | Mar | Apr | May | Jun | Jul | Aug | Sep | Oct | Nov | Dec |
|---|---|---|---|---|---|---|---|---|---|---|---|---|
| 1989 | 27,838 | 29,591 | 25,963 | 15,899 | 9,308 | 5,975 | 5,445 | 4,862 | 6,177 | 11,093 | 20,173 | 33,847 |
| 1990 | 30,713 | 25,802 | 22,068 | 17,635 | 10,676 | 6,785 | 7,008 | 7,341 | 7,970 | 15,118 | 19,910 | 29,245 |
| 1991 | 35,376 | 26,327 | 22,768 | 13,059 | 8,214 | 5,162 | 6,031 | 5,693 | 7,979 | 11,574 | 23,098 | 28,563 |
| 1992 | 30,506 | 26,501 | 23,400 | 17,598 | 8,872 | 4,907 | 5,811 | 6,025 | 6,618 | 12,394 | 22,757 | 31,575 |
| 1993 | 33,166 | 29,686 | 27,677 | 17,598 | 7,744 | 5,101 | 5,879 | 5,644 | 7,362 | 13,064 | 22,147 | 28,088 |
| 1994 | 39,478 | 32,675 | 24,021 | 14,447 | 7,714 | 6,150 | 5,803 | 6,226 | 6,544 | 11,431 | 18,158 | 24,912 |
| 1995 | 34,345 | 30,538 | 23,332 | 15,643 | 9,135 | 6,157 | 6,035 | 6,612 | 6,984 | 11,880 | 22,408 | 30,734 |
| 1996 | 36,723 | 33,140 | 27,306 | 17,937 | 9,659 | 5,695 | 5,426 | 5,314 | 7,125 | 12,090 | 25,216 | 32,425 |
| 1997 | 36,666 | 29,596 | 23,084 | 16,531 | 10,471 | 6,052 | 5,970 | 5,809 | 6,425 | 12,291 | 22,861 | 27,094 |
| 1998 | 30,391 | 22,336 | 23,767 | 15,152 | 6,893 | 6,242 | 5,203 | 6,399 | 6,521 | 9,948 | 17,109 | 24,727 |
| 1999 | 35,733 | 26,362 | 24,683 | 14,117 | 8,306 | 5,976 | 6,186 | 6,152 | 6,918 | 11,929 | 15,089 | 27,069 |
| 2000 | 34,670 | 27,474 | 19,510 | 15,395 | 8,281 | 6,325 | 6,246 | 6,704 | 7,544 | 10,550 | 21,467 | 37,604 |
| 2001 | 34,687 | 30,186 | 26,259 | 12,190 | 7,784 | 6,206 | 6,161 | 6,333 | 7,631 | 12,120 | 14,372 | 25,230 |
| 2002 | 29,952 | 26,156 | 24,832 | 19,118 | 11,204 | 7,082 | 6,736 | 6,722 | 7,809 | 14,279 | 21,703 | 28,977 |
| 2003 | 37,747 | 33,540 | 26,285 | 15,577 | 9,138 | 6,234 | 6,817 | 6,368 | 7,876 | 12,670 | 19,454 | 30,005 |
| 2004 | 36,022 | 32,461 | 23,798 | 14,937 | 9,030 | 7,453 | 7,277 | 7,256 | 7,754 | 11,416 | 17,347 | 29,289 |
| 2005 | 35,200 | 27,427 | 26,904 | 13,751 | 9,820 | 7,005 | 6,449 | 6,558 | 7,234 | 10,717 | 17,770 | 33,048 |
| 2006 | 27,915 | 28,307 | 24,390 | 15,690 | 9,521 | 8,929 | 7,232 | 7,757 | 8,063 | 14,140 | 19,817 | 24,601 |
| 2007 | 28,960 | 34,989 | 25,990 | 17,730 | 11,100 | 7,553 | 6,860 | 7,103 | 7,340 | 9,913 | 17,612 | 28,218 |
| 2008 | 34,218 | 34,484 | 28,749 | 19,497 | 11,478 | 6,909 | 7,547 | 6,674 | 7,247 | 12,062 | 19,638 | 33,878 |
| 2009 | 37,962 | 32,189 | 26,653 | 17,833 | 9,629 | 7,756 | 8,353 | 7,817 | 8,181 | 14,584 | 18,108 | 33,705 |
| 2010 | 35,072 | 28,323 | 23,327 | 11,881 | 8,445 | 6,570 | 6,196 | 6,448 | 7,447 | 10,884 | 20,568 | 32,874 |
| 2011 | 39,942 | 28,569 | 23,708 | 15,684 | 10,296 | 7,105 | 7,804 | 7,918 | 9,618 | 15,813 | 21,756 | 27,393 |
| 2012 | 31,992 | 27,643 | 15,508 | 13,143 | 8,011 | 7,153 | 6,803 | 7,135 | 8,893 | 15,286 | 20,617 | 25,916 |
| 2013 | 34,422 | 30,974 | 29,937 | 17,444 | 9,489 | 7,460 | 7,505 | 7,700 | 8,319 | 15,630 | 25,955 | 35,985 |
| 2014 | 45,646 | 38,151 | 30,968 | 16,462 | 10,946 | 7,965 | 7,789 | 7,632 | 8,922 | 14,788 | 27,746 | 29,259 |
| 2015 | 38,856 | 39,507 | 27,346 | 15,102 | 9,179 | 7,293 | 7,358 | 7,840 | 7,827 | 12,469 | 18,019 | 24,423 |
| 2016 | 36,445 | 31,008 | 21,675 | 16,018 | 10,636 | 7,348 | 7,986 | 7,988 | 8,283 | 12,700 | 17,391 | 35,004 |
| 2017 | 35,360 | 24,480 | 25,913 | 13,518 | 12,630 | 7,561 | 7,683 | 8,052 | 8,816 | 13,692 | 22,288 | 35,923 |
| 2018 | 39,391 | 32,965 | 28,302 | 23,081 | 10,255 | 8,498 | 8,606 | 8,566 | 8,852 | 15,973 | 26,568 | 30,916 |
| 2019 | 40,527 | 34,453 | 31,298 | 18,491 | 12,202 | 8,556 | 8,412 | 8,239 | 8,344 | 14,881 | 29,799 | 32,156 |
| 2020 | 34,265 | 33,666 | 25,111 | 17,495 | 11,290 | 7,110 | 6,900 | 6,647 | 8,436 | 15,674 | 19,214 | 29,544 |
| 2021 | 34,747 | 39,198 | 26,170 | 16,846 | 11,551 | 8,303 | 8,186 | 7,896 | 9,098 | 12,272 | 20,235 | 28,403 |
| 2022 | 39,993 | 35,903 | 28,027 | 21,306 | 11,808 | 7,856 | 8,086 | 7,914 | 9,226 | 15,611 | 23,935 | 34,835 |
| 2023 | 34,825 | 30,651 | 28,949 | 17,066 | 11,220 | 8,271 | 8,250 | 8,062 | 8,122 | 14,755 | 21,512 | 27,464 |
| 2024 | 35,980 | 28,802 | 23,173 | 16,615 | 9,831 | 7,700 | ||||||
| - = No Data Reported; -- = Not Applicable; NA = Not Available; W = Withheld to avoid disclosure of individual company data. |
| Release Date: 8/30/2024 |
| Next Release Date: 9/30/2024 |