|
Download Data (XLS File) |
|
||||||||
|
||||||||
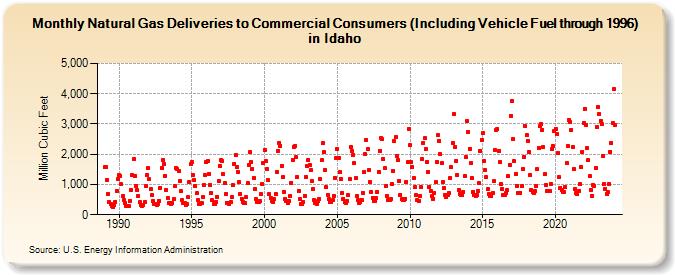
| Natural Gas Deliveries to Commercial Consumers (Including Vehicle Fuel through 1996) in Idaho (Million Cubic Feet) | ||||||||
| Year | Jan | Feb | Mar | Apr | May | Jun | Jul | Aug | Sep | Oct | Nov | Dec |
|---|---|---|---|---|---|---|---|---|---|---|---|---|
| 1989 | 1,567 | 1,575 | 1,160 | 692 | 409 | 355 | 301 | 249 | 321 | 435 | 785 | 1,176 |
| 1990 | 1,313 | 1,283 | 1,000 | 610 | 479 | 389 | 293 | 280 | 292 | 459 | 822 | 1,315 |
| 1991 | 1,848 | 1,291 | 956 | 822 | 623 | 405 | 316 | 304 | 329 | 424 | 942 | 1,321 |
| 1992 | 1,543 | 1,167 | 834 | 643 | 447 | 343 | 345 | 330 | 369 | 465 | 889 | 1,557 |
| 1993 | 1,806 | 1,673 | 1,294 | 828 | 566 | 387 | 383 | 360 | 381 | 507 | 947 | 1,543 |
| 1994 | 1,510 | 1,457 | 1,121 | 771 | 480 | 377 | 374 | 306 | 357 | 571 | 1,098 | 1,667 |
| 1995 | 1,754 | 1,319 | 1,154 | 951 | 708 | 487 | 361 | 346 | 392 | 591 | 997 | 1,300 |
| 1996 | 1,734 | 1,783 | 1,359 | 996 | 710 | 477 | 346 | 354 | 421 | 597 | 1,107 | 1,621 |
| 1997 | 1,810 | 1,778 | 1,341 | 1,037 | 684 | 397 | 372 | 354 | 409 | 584 | 979 | 1,687 |
| 1998 | 1,969 | 1,564 | 1,417 | 1,072 | 686 | 535 | 405 | 380 | 386 | 577 | 1,045 | 1,640 |
| 1999 | 2,067 | 1,727 | 1,526 | 1,228 | 849 | 518 | 423 | 418 | 457 | 673 | 1,025 | 1,705 |
| 2000 | 2,152 | 1,772 | 1,526 | 1,132 | 674 | 554 | 457 | 418 | 507 | 690 | 1,415 | 2,117 |
| 2001 | 2,375 | 2,285 | 1,626 | 1,235 | 762 | 526 | 456 | 402 | 462 | 613 | 1,060 | 1,820 |
| 2002 | 2,254 | 2,288 | 1,894 | 1,243 | 800 | 509 | 349 | 352 | 423 | 634 | 1,249 | 1,597 |
| 2003 | 1,809 | 1,635 | 1,470 | 1,102 | 839 | 485 | 377 | 356 | 439 | 533 | 1,177 | 1,795 |
| 2004 | 2,361 | 2,073 | 1,485 | 907 | 654 | 518 | 410 | 415 | 472 | 624 | 1,218 | 1,859 |
| 2005 | 2,172 | 1,887 | 1,403 | 1,196 | 719 | 532 | 413 | 373 | 466 | 657 | 1,171 | 2,240 |
| 2006 | 2,123 | 1,983 | 1,705 | 1,200 | 629 | 480 | 402 | 407 | 503 | 722 | 1,418 | 2,003 |
| 2007 | 2,478 | 2,166 | 1,473 | 1,076 | 759 | 567 | 464 | 442 | 545 | 764 | 1,417 | 2,123 |
| 2008 | 2,521 | 2,491 | 1,838 | 1,533 | 946 | 619 | 475 | 481 | 525 | 1,014 | 1,458 | 2,434 |
| 2009 | 2,567 | 1,926 | 1,797 | 1,116 | 662 | 508 | 477 | 496 | 532 | 1,092 | 1,729 | 2,836 |
| 2010 | 2,291 | 1,728 | 1,580 | 1,222 | 901 | 638 | 485 | 457 | 620 | 903 | 1,826 | 2,384 |
| 2011 | 2,522 | 2,167 | 1,739 | 1,405 | 923 | 791 | 617 | 536 | 717 | 1,066 | 1,748 | 2,623 |
| 2012 | 2,444 | 1,999 | 1,707 | 1,069 | 871 | 664 | 576 | 644 | 708 | 1,219 | 1,563 | 2,372 |
| 2013 | 3,330 | 2,244 | 1,776 | 1,305 | 828 | 694 | 642 | 641 | 763 | 1,282 | 1,892 | 3,087 |
| 2014 | 2,739 | 2,185 | 1,715 | 1,216 | 766 | 661 | 627 | 660 | 777 | 1,038 | 2,107 | 2,472 |
| 2015 | 2,687 | 1,770 | 1,477 | 1,235 | 850 | 685 | 627 | 603 | 718 | 1,102 | 2,140 | 2,812 |
| 2016 | 2,827 | 2,111 | 1,734 | 1,009 | 865 | 664 | 668 | 712 | 811 | 1,266 | 1,658 | 3,274 |
| 2017 | 3,769 | 2,492 | 1,765 | 1,349 | 959 | 719 | 705 | 732 | 944 | 1,495 | 1,924 | 2,924 |
| 2018 | 2,627 | 2,449 | 2,086 | 1,321 | 810 | 763 | 714 | 775 | 938 | 1,499 | 2,212 | 2,919 |
| 2019 | 3,007 | 2,812 | 2,223 | 1,346 | 988 | 792 | 782 | 788 | 1,023 | 2,180 | 2,271 | 2,760 |
| 2020 | 2,845 | 2,662 | 2,035 | 1,246 | 887 | 805 | 751 | 742 | 923 | 1,695 | 2,273 | 3,136 |
| 2021 | 3,065 | 2,815 | 2,236 | 1,515 | 857 | 729 | 670 | 787 | 1,001 | 1,578 | 2,088 | 3,045 |
| 2022 | 3,507 | 2,970 | 2,196 | 1,796 | 1,265 | 828 | 626 | 983 | 960 | 1,560 | 2,905 | 3,562 |
| 2023 | 3,336 | 3,112 | 2,990 | 1,939 | 1,014 | 859 | 701 | 736 | 1,018 | 2,083 | 2,380 | 3,025 |
| 2024 | 4,142 | |||||||||||
| - = No Data Reported; -- = Not Applicable; NA = Not Available; W = Withheld to avoid disclosure of individual company data. |
| Release Date: 3/29/2024 |
| Next Release Date: 4/30/2024 |