|
Download Data (XLS File) |
|
||||||||
|
||||||||
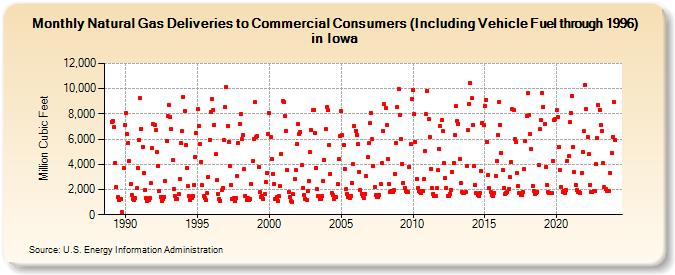
| Natural Gas Deliveries to Commercial Consumers (Including Vehicle Fuel through 1996) in Iowa (Million Cubic Feet) | ||||||||
| Year | Jan | Feb | Mar | Apr | May | Jun | Jul | Aug | Sep | Oct | Nov | Dec |
|---|---|---|---|---|---|---|---|---|---|---|---|---|
| 1989 | 7,372 | 7,466 | 6,928 | 4,133 | 2,216 | 1,380 | 1,190 | 1,234 | 1,247 | 179 | 3,738 | 7,110 |
| 1990 | 8,087 | 6,374 | 5,719 | 4,261 | 2,409 | 1,602 | 1,226 | 1,204 | 1,302 | 2,087 | 3,726 | 5,955 |
| 1991 | 9,237 | 6,828 | 5,412 | 3,305 | 1,993 | 1,308 | 1,090 | 1,198 | 1,308 | 2,482 | 5,287 | 7,167 |
| 1992 | 7,145 | 6,709 | 4,949 | 3,883 | 1,877 | 1,427 | 1,100 | 1,257 | 1,433 | 2,645 | 5,843 | 7,827 |
| 1993 | 8,688 | 7,779 | 6,773 | 4,316 | 2,029 | 1,481 | 1,214 | 1,214 | 1,637 | 2,869 | 5,694 | 6,642 |
| 1994 | 9,353 | 8,260 | 5,503 | 3,725 | 2,254 | 1,488 | 1,160 | 1,288 | 1,492 | 2,340 | 4,562 | 6,497 |
| 1995 | 8,351 | 7,042 | 5,633 | 4,189 | 2,321 | 1,484 | 1,310 | 1,150 | 1,701 | 3,021 | 5,952 | 8,170 |
| 1996 | 9,219 | 8,342 | 7,103 | 4,783 | 2,734 | 1,664 | 1,212 | 1,080 | 1,926 | 2,101 | 5,896 | 8,510 |
| 1997 | 10,143 | 7,031 | 5,789 | 3,877 | 2,382 | 1,238 | 1,305 | 1,114 | 1,359 | 3,037 | 5,707 | 7,210 |
| 1998 | 7,972 | 5,991 | 6,362 | 3,593 | 1,513 | 1,200 | 1,353 | 1,166 | 1,210 | 2,402 | 4,261 | 6,006 |
| 1999 | 8,909 | 6,169 | 6,211 | 3,779 | 1,768 | 1,406 | 1,519 | 1,246 | 1,625 | 2,576 | 3,276 | 6,411 |
| 2000 | 8,032 | 6,155 | 4,416 | 3,263 | 2,439 | 1,273 | 1,400 | 1,086 | 1,462 | 2,242 | 4,831 | 9,010 |
| 2001 | 8,964 | 7,805 | 6,671 | 3,548 | 1,812 | 1,426 | 1,086 | 998 | 1,605 | 2,840 | 3,555 | 5,582 |
| 2002 | 7,186 | 6,437 | 6,548 | 3,914 | 2,146 | 1,528 | 1,279 | 1,189 | 1,843 | 2,690 | 4,946 | 6,716 |
| 2003 | 8,292 | 8,321 | 6,509 | 3,724 | 2,003 | 1,498 | 1,258 | 1,246 | 1,457 | 2,654 | 4,350 | 6,767 |
| 2004 | 8,559 | 8,295 | 5,533 | 3,236 | 1,752 | 1,531 | 1,262 | 1,422 | 1,373 | 2,473 | 4,391 | 6,241 |
| 2005 | 8,192 | 6,314 | 5,527 | 3,661 | 2,020 | 1,650 | 1,412 | 1,345 | 1,502 | 2,506 | 3,997 | 7,027 |
| 2006 | 6,671 | 6,338 | 5,598 | 3,414 | 1,993 | 1,675 | 1,484 | 1,319 | 1,649 | 3,045 | 4,571 | 5,666 |
| 2007 | 7,239 | 8,078 | 5,985 | 3,826 | 2,186 | 1,533 | 1,426 | 1,401 | 1,566 | 2,420 | 4,067 | 6,642 |
| 2008 | 8,760 | 8,498 | 7,113 | 4,411 | 2,405 | 1,805 | 1,851 | 1,835 | 1,957 | 3,191 | 5,726 | 8,548 |
| 2009 | 10,000 | 7,937 | 6,040 | 4,055 | 2,531 | 2,113 | 1,895 | 1,783 | 1,793 | 3,810 | 5,593 | 9,148 |
| 2010 | 9,873 | 7,968 | 5,752 | 2,857 | 2,099 | 1,899 | 1,772 | 1,698 | 1,895 | 2,824 | 5,050 | 7,985 |
| 2011 | 9,825 | 7,560 | 6,182 | 3,640 | 2,142 | 1,674 | 1,458 | 1,513 | 2,104 | 3,524 | 5,236 | 7,019 |
| 2012 | 7,508 | 6,605 | 4,068 | 2,910 | 2,145 | 1,489 | 1,499 | 1,625 | 1,993 | 3,424 | 4,142 | 6,359 |
| 2013 | 8,633 | 7,410 | 7,204 | 4,414 | 2,482 | 1,785 | 1,751 | 1,740 | 1,794 | 3,860 | 6,700 | 8,819 |
| 2014 | 10,477 | 9,232 | 7,134 | 3,851 | 2,396 | 1,700 | 1,580 | 1,475 | 1,724 | 3,450 | 7,303 | 7,117 |
| 2015 | 8,625 | 9,104 | 5,800 | 3,158 | 2,108 | 1,804 | 1,597 | 1,495 | 1,748 | 3,103 | 4,259 | 6,364 |
| 2016 | 8,918 | 7,139 | 4,933 | 3,531 | 2,134 | 1,604 | 1,758 | 1,827 | 2,053 | 2,969 | 4,181 | 8,367 |
| 2017 | 8,330 | 6,003 | 5,799 | 3,276 | 2,283 | 1,752 | 1,597 | 1,579 | 1,802 | 3,597 | 5,820 | 7,870 |
| 2018 | 9,679 | 7,931 | 6,399 | 5,194 | 2,304 | 1,893 | 1,659 | 1,744 | 1,806 | 3,962 | 6,784 | 7,499 |
| 2019 | 9,692 | 8,582 | 7,161 | 3,748 | 2,396 | 1,763 | 1,731 | 1,757 | 1,742 | 4,271 | 7,535 | 7,608 |
| 2020 | 8,282 | 7,732 | 5,378 | 3,579 | 2,182 | 1,823 | 1,860 | 1,751 | 1,941 | 4,265 | 4,638 | 7,335 |
| 2021 | 8,104 | 9,440 | 5,375 | 3,383 | 2,397 | 1,930 | 1,812 | 1,822 | 1,755 | 3,303 | 4,994 | 6,603 |
| 2022 | 10,277 | 8,362 | 6,191 | 4,794 | 2,385 | 1,766 | 1,807 | 1,877 | 1,846 | 4,018 | 6,048 | 8,702 |
| 2023 | 8,316 | 7,116 | 6,663 | 4,069 | 2,162 | 2,050 | 1,913 | 1,891 | 1,862 | 3,327 | 4,897 | 6,189 |
| 2024 | 8,980 | |||||||||||
| - = No Data Reported; -- = Not Applicable; NA = Not Available; W = Withheld to avoid disclosure of individual company data. |
| Release Date: 3/29/2024 |
| Next Release Date: 4/30/2024 |