|
Download Data (XLS File) |
|
||||||||
|
||||||||
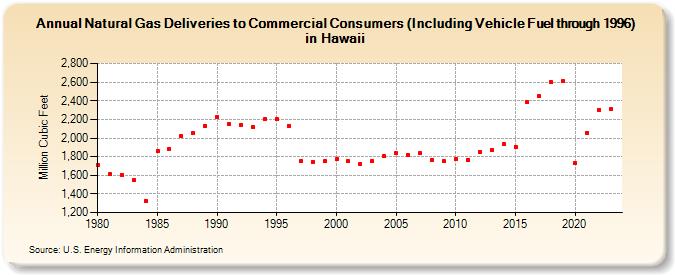
| Natural Gas Deliveries to Commercial Consumers (Including Vehicle Fuel through 1996) in Hawaii (Million Cubic Feet) | ||||||||
| Decade | Year-0 | Year-1 | Year-2 | Year-3 | Year-4 | Year-5 | Year-6 | Year-7 | Year-8 | Year-9 |
|---|---|---|---|---|---|---|---|---|---|---|
| 1980's | 1,715 | 1,610 | 1,607 | 1,548 | 1,328 | 1,858 | 1,883 | 2,019 | 2,049 | 2,129 |
| 1990's | 2,223 | 2,148 | 2,144 | 2,123 | 2,200 | 2,199 | 2,132 | 1,751 | 1,747 | 1,749 |
| 2000's | 1,771 | 1,749 | 1,720 | 1,751 | 1,803 | 1,838 | 1,813 | 1,836 | 1,769 | 1,752 |
| 2010's | 1,777 | 1,768 | 1,850 | 1,873 | 1,931 | 1,908 | 2,384 | 2,446 | 2,601 | 2,608 |
| 2020's | 1,730 | 2,059 | 2,304 | 2,310 |
| - = No Data Reported; -- = Not Applicable; NA = Not Available; W = Withheld to avoid disclosure of individual company data. |
| Release Date: 3/29/2024 |
| Next Release Date: 4/30/2024 |