|
Download Data (XLS File) |
|
||||||||
|
||||||||
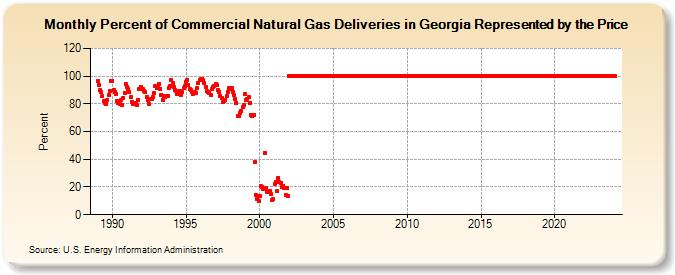
| Percent of Commercial Natural Gas Deliveries in Georgia Represented by the Price (Percent) | ||||||||
| Year | Jan | Feb | Mar | Apr | May | Jun | Jul | Aug | Sep | Oct | Nov | Dec |
|---|---|---|---|---|---|---|---|---|---|---|---|---|
| 1989 | 96.6 | 93.6 | 89.7 | 88.2 | 85.3 | 81.7 | 80.7 | 80.2 | 83.0 | 86.4 | 89.4 | 96.8 |
| 1990 | 96.5 | 90.3 | 88.7 | 86.9 | 82.0 | 80.9 | 80.1 | 82.5 | 78.9 | 84.3 | 87.9 | 94.1 |
| 1991 | 92.1 | 90.7 | 88.8 | 84.7 | 81.6 | 79.7 | 79.6 | 80.3 | 78.8 | 82.8 | 90.7 | 92.5 |
| 1992 | 90.8 | 90.6 | 89.3 | 88.2 | 85.0 | 82.7 | 79.7 | 83.3 | 83.4 | 84.6 | 87.9 | 92.9 |
| 1993 | 91.5 | 92.9 | 94.6 | 90.9 | 86.5 | 83.0 | 85.4 | 84.9 | 85.6 | 86.0 | 91.2 | 93.0 |
| 1994 | 97.0 | 94.9 | 92.4 | 90.3 | 89.3 | 86.8 | 87.9 | 89.0 | 86.1 | 88.6 | 91.6 | 92.6 |
| 1995 | 96.1 | 97.1 | 93.3 | 90.7 | 89.7 | 88.4 | 87.4 | 88.4 | 87.9 | 91.1 | 94.8 | 97.2 |
| 1996 | 97.7 | 98.1 | 96.9 | 94.9 | 92.2 | 89.0 | 88.7 | 88.1 | 86.6 | 90.6 | 92.2 | 93.2 |
| 1997 | 94.3 | 93.5 | 90.0 | 88.5 | 85.4 | 84.3 | 81.0 | 81.9 | 82.9 | 85.6 | 88.6 | 91.6 |
| 1998 | 90.7 | 91.3 | 88.8 | 86.3 | 83.7 | 80.9 | 71.5 | 71.5 | 73.6 | 74.6 | 77.4 | 79.2 |
| 1999 | 87.1 | 83.1 | 83.7 | 84.8 | 80.4 | 72.1 | 71.0 | 72.2 | 37.8 | 14.5 | 11.0 | 9.6 |
| 2000 | 13.3 | 20.4 | 20.0 | 18.5 | 44.7 | 19.1 | 16.4 | 16.3 | 16.8 | 14.7 | 10.8 | 11.1 |
| 2001 | 21.8 | 23.9 | 16.8 | 26.8 | 23.5 | 23.1 | 20.1 | 20.9 | 19.5 | 13.9 | 19.0 | 13.7 |
| 2002 | 100.0 | 100.0 | 100.0 | 100.0 | 100.0 | 100.0 | 100.0 | 100.0 | 100.0 | 100.0 | 100.0 | 100.0 |
| 2003 | 100.0 | 100.0 | 100.0 | 100.0 | 100.0 | 100.0 | 100.0 | 100.0 | 100.0 | 100.0 | 100.0 | 100.0 |
| 2004 | 100.0 | 100.0 | 100.0 | 100.0 | 100.0 | 100.0 | 100.0 | 100.0 | 100.0 | 100.0 | 100.0 | 100.0 |
| 2005 | 100.0 | 100.0 | 100.0 | 100.0 | 100.0 | 100.0 | 100.0 | 100.0 | 100.0 | 100.0 | 100.0 | 100.0 |
| 2006 | 100.0 | 100.0 | 100.0 | 100.0 | 100.0 | 100.0 | 100.0 | 100.0 | 100.0 | 100.0 | 100.0 | 100.0 |
| 2007 | 100.0 | 100.0 | 100.0 | 100.0 | 100.0 | 100.0 | 100.0 | 100.0 | 100.0 | 100.0 | 100.0 | 100.0 |
| 2008 | 100.0 | 100.0 | 100.0 | 100.0 | 100.0 | 100.0 | 100.0 | 100.0 | 100.0 | 100.0 | 100.0 | 100.0 |
| 2009 | 100.0 | 100.0 | 100.0 | 100.0 | 100.0 | 100.0 | 100.0 | 100.0 | 100.0 | 100.0 | 100.0 | 100.0 |
| 2010 | 100.0 | 100.0 | 100.0 | 100.0 | 100.0 | 100.0 | 100.0 | 100.0 | 100.0 | 100.0 | 100.0 | 100.0 |
| 2011 | 100.0 | 100.0 | 100.0 | 100.0 | 100.0 | 100.0 | 100.0 | 100.0 | 100.0 | 100.0 | 100.0 | 100.0 |
| 2012 | 100.0 | 100.0 | 100.0 | 100.0 | 100.0 | 100.0 | 100.0 | 100.0 | 100.0 | 100.0 | 100.0 | 100.0 |
| 2013 | 100.0 | 100.0 | 100.0 | 100.0 | 100.0 | 100.0 | 100.0 | 100.0 | 100.0 | 100.0 | 100.0 | 100.0 |
| 2014 | 100.0 | 100.0 | 100.0 | 100.0 | 100.0 | 100.0 | 100.0 | 100.0 | 100.0 | 100.0 | 100.0 | 100.0 |
| 2015 | 100.0 | 100.0 | 100.0 | 100.0 | 100.0 | 100.0 | 100.0 | 100.0 | 100.0 | 100.0 | 100.0 | 100.0 |
| 2016 | 100.0 | 100.0 | 100.0 | 100.0 | 100.0 | 100.0 | 100.0 | 100.0 | 100.0 | 100.0 | 100.0 | 100.0 |
| 2017 | 100.0 | 100.0 | 100.0 | 100.0 | 100.0 | 100.0 | 100.0 | 100.0 | 100.0 | 100.0 | 100.0 | 100.0 |
| 2018 | 100.0 | 100.0 | 100.0 | 100.0 | 100.0 | 100.0 | 100.0 | 100.0 | 100.0 | 100.0 | 100.0 | 100.0 |
| 2019 | 100.0 | 100.0 | 100.0 | 100.0 | 100.0 | 100.0 | 100.0 | 100.0 | 100.0 | 100.0 | 100.0 | 100.0 |
| 2020 | 100.0 | 100.0 | 100.0 | 100.0 | 100.0 | 100.0 | 100.0 | 100.0 | 100.0 | 100.0 | 100.0 | 100.0 |
| 2021 | 100.0 | 100.0 | 100.0 | 100.0 | 100.0 | 100.0 | 100.0 | 100.0 | 100.0 | 100.0 | 100.0 | 100.0 |
| 2022 | 100.0 | 100.0 | 100.0 | 100.0 | 100.0 | 100.0 | 100.0 | 100.0 | 100.0 | 100.0 | 100.0 | 100.0 |
| 2023 | 100.0 | 100.0 | 100.0 | 100.0 | 100.0 | 100.0 | 100.0 | 100.0 | 100.0 | 100.0 | 100.0 | 100.0 |
| 2024 | 100.0 | |||||||||||
| - = No Data Reported; -- = Not Applicable; NA = Not Available; W = Withheld to avoid disclosure of individual company data. |
| Release Date: 3/29/2024 |
| Next Release Date: 4/30/2024 |