|
Download Data (XLS File) |
|
||||||||
|
||||||||
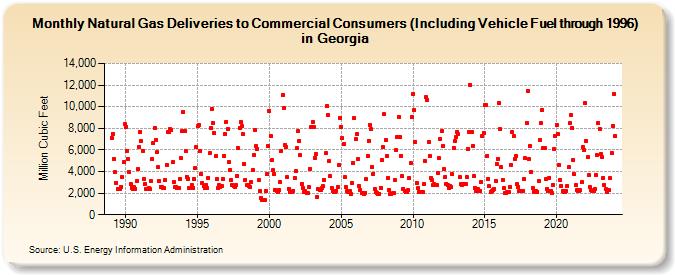
| Natural Gas Deliveries to Commercial Consumers (Including Vehicle Fuel through 1996) in Georgia (Million Cubic Feet) | ||||||||
| Year | Jan | Feb | Mar | Apr | May | Jun | Jul | Aug | Sep | Oct | Nov | Dec |
|---|---|---|---|---|---|---|---|---|---|---|---|---|
| 1989 | 7,127 | 7,499 | 5,163 | 3,921 | 2,982 | 2,340 | 2,411 | 2,360 | 2,589 | 3,475 | 4,834 | 8,389 |
| 1990 | 8,162 | 5,935 | 5,172 | 3,960 | 2,844 | 2,498 | 2,359 | 2,535 | 2,416 | 3,098 | 4,228 | 6,280 |
| 1991 | 7,680 | 6,782 | 5,905 | 3,348 | 2,820 | 2,387 | 2,381 | 2,482 | 2,346 | 3,082 | 5,153 | 6,670 |
| 1992 | 8,066 | 6,952 | 5,778 | 4,381 | 3,103 | 2,596 | 2,536 | 2,503 | 2,462 | 3,201 | 4,640 | 7,642 |
| 1993 | 7,627 | 7,915 | 7,796 | 4,837 | 3,069 | 2,544 | 2,570 | 2,481 | 2,440 | 3,312 | 5,214 | 7,719 |
| 1994 | 9,543 | 7,722 | 5,854 | 3,488 | 3,332 | 2,488 | 2,499 | 2,709 | 2,483 | 3,315 | 4,361 | 6,258 |
| 1995 | 8,182 | 8,315 | 5,870 | 3,739 | 2,918 | 2,615 | 2,519 | 2,781 | 2,450 | 3,379 | 5,706 | 8,062 |
| 1996 | 9,815 | 8,514 | 7,564 | 5,425 | 3,297 | 2,508 | 2,737 | 2,594 | 2,673 | 3,339 | 5,450 | 7,462 |
| 1997 | 8,608 | 7,939 | 4,853 | 4,135 | 3,191 | 2,776 | 2,677 | 2,597 | 2,718 | 3,553 | 6,139 | 8,034 |
| 1998 | 8,545 | 8,205 | 7,438 | 4,687 | 3,243 | 2,718 | 2,712 | 2,618 | 2,584 | 3,045 | 4,094 | 5,531 |
| 1999 | 7,807 | 6,334 | 6,102 | 3,185 | 2,169 | 1,549 | 1,395 | 1,397 | 1,367 | 2,206 | 3,754 | 6,318 |
| 2000 | 9,620 | 7,290 | 5,029 | 4,104 | 3,788 | 2,304 | 2,158 | 2,122 | 2,292 | 3,063 | 5,922 | 11,100 |
| 2001 | 9,892 | 6,455 | 6,288 | 3,450 | 2,424 | 2,147 | 2,058 | 2,102 | 2,230 | 3,443 | 4,008 | 6,149 |
| 2002 | 7,718 | 6,850 | 5,509 | 2,880 | 2,496 | 2,078 | 2,159 | 1,984 | 1,997 | 2,556 | 4,256 | 8,148 |
| 2003 | 8,587 | 8,135 | 5,264 | 5,621 | 1,682 | 2,355 | 2,313 | 2,331 | 2,481 | 2,614 | 3,208 | 5,682 |
| 2004 | 10,051 | 9,202 | 4,971 | 3,555 | 2,482 | 2,189 | 2,094 | 2,145 | 2,226 | 2,548 | 4,615 | 8,970 |
| 2005 | 8,149 | 7,080 | 6,532 | 3,484 | 2,588 | 2,184 | 2,123 | 2,156 | 1,940 | 2,907 | 4,805 | 8,952 |
| 2006 | 7,005 | 7,433 | 5,145 | 2,639 | 2,293 | 2,056 | 1,995 | 1,943 | 2,050 | 3,305 | 5,418 | 6,855 |
| 2007 | 8,304 | 7,934 | 4,428 | 3,796 | 2,341 | 2,088 | 2,017 | 1,878 | 1,946 | 2,500 | 5,085 | 6,273 |
| 2008 | 9,278 | 6,908 | 5,426 | 3,389 | 2,316 | 1,916 | 1,927 | 1,969 | 1,987 | 3,239 | 5,954 | 7,210 |
| 2009 | 9,066 | 7,203 | 5,467 | 3,604 | 2,420 | 2,215 | 2,079 | 2,098 | 2,255 | 3,393 | 4,804 | 9,023 |
| 2010 | 11,163 | 9,701 | 6,734 | 2,982 | 2,428 | 2,126 | 2,110 | 2,104 | 2,094 | 2,837 | 5,005 | 10,868 |
| 2011 | 10,634 | 6,713 | 5,444 | 3,422 | 3,209 | 2,776 | 2,825 | 2,708 | 2,719 | 3,905 | 5,221 | 7,026 |
| 2012 | 7,768 | 6,351 | 4,188 | 3,493 | 2,871 | 2,707 | 2,514 | 2,686 | 2,573 | 3,726 | 6,200 | 6,843 |
| 2013 | 7,191 | 7,667 | 7,430 | 3,510 | 2,821 | 2,766 | 2,851 | 2,850 | 2,874 | 3,453 | 6,099 | 7,683 |
| 2014 | 12,019 | 7,646 | 6,380 | 3,545 | 2,519 | 2,223 | 2,350 | 2,234 | 2,220 | 3,022 | 7,295 | 7,600 |
| 2015 | 10,187 | 10,135 | 5,480 | 3,298 | 2,626 | 2,094 | 2,162 | 2,277 | 2,421 | 3,165 | 4,704 | 5,195 |
| 2016 | 10,341 | 7,910 | 4,392 | 3,221 | 2,437 | 2,052 | 2,007 | 2,066 | 2,086 | 2,574 | 4,604 | 7,639 |
| 2017 | 7,263 | 5,190 | 5,419 | 2,817 | 2,594 | 2,215 | 2,165 | 2,213 | 2,232 | 3,325 | 5,224 | 8,535 |
| 2018 | 11,453 | 5,117 | 6,407 | 3,978 | 2,460 | 2,149 | 2,168 | 2,172 | 2,114 | 3,127 | 6,912 | 8,483 |
| 2019 | 9,737 | 6,135 | 6,151 | 3,268 | 2,422 | 2,182 | 3,442 | 2,164 | 2,011 | 2,777 | 6,049 | 7,271 |
| 2020 | 8,310 | 7,511 | 4,623 | 3,257 | 2,664 | 2,185 | 2,072 | 2,130 | 2,204 | 2,677 | 4,387 | 8,452 |
| 2021 | 9,250 | 8,044 | 5,096 | 3,745 | 2,714 | 2,272 | 2,237 | 2,205 | 2,252 | 3,016 | 6,263 | 5,988 |
| 2022 | 10,352 | 6,827 | 5,317 | 3,636 | 2,559 | 2,258 | 2,183 | 2,197 | 2,339 | 3,643 | 5,519 | 8,496 |
| 2023 | 7,938 | 5,622 | 5,341 | 3,432 | 2,740 | 2,342 | 2,141 | 2,266 | 2,235 | 3,634 | 5,747 | 8,228 |
| 2024 | 11,199 | |||||||||||
| - = No Data Reported; -- = Not Applicable; NA = Not Available; W = Withheld to avoid disclosure of individual company data. |
| Release Date: 3/29/2024 |
| Next Release Date: 4/30/2024 |