|
Download Data (XLS File) |
|
||||||||
|
||||||||
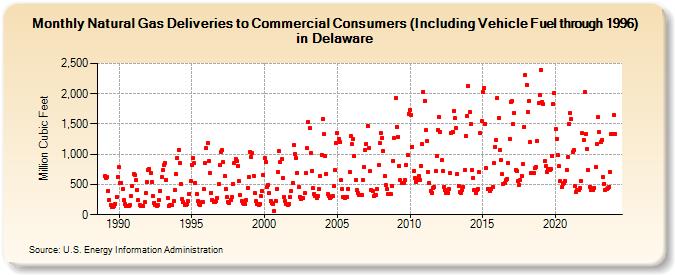
| Natural Gas Deliveries to Commercial Consumers (Including Vehicle Fuel through 1996) in Delaware (Million Cubic Feet) | ||||||||
| Year | Jan | Feb | Mar | Apr | May | Jun | Jul | Aug | Sep | Oct | Nov | Dec |
|---|---|---|---|---|---|---|---|---|---|---|---|---|
| 1989 | 632 | 605 | 624 | 398 | 249 | 166 | 128 | 133 | 144 | 182 | 294 | 630 |
| 1990 | 784 | 530 | 530 | 419 | 239 | 174 | 139 | 138 | 136 | 163 | 309 | 480 |
| 1991 | 677 | 653 | 579 | 414 | 237 | 161 | 146 | 142 | 145 | 203 | 354 | 541 |
| 1992 | 744 | 755 | 686 | 537 | 308 | 198 | 166 | 152 | 162 | 240 | 395 | 622 |
| 1993 | 739 | 818 | 858 | 574 | 284 | 140 | 165 | 155 | 155 | 229 | 412 | 666 |
| 1994 | 945 | 1,076 | 856 | 510 | 259 | 209 | 157 | 156 | 172 | 221 | 345 | 554 |
| 1995 | 829 | 935 | 854 | 527 | 341 | 223 | 182 | 168 | 205 | 209 | 417 | 851 |
| 1996 | 1,099 | 1,181 | 885 | 691 | 365 | 245 | 202 | 203 | 223 | 277 | 502 | 821 |
| 1997 | 1,041 | 1,062 | 871 | 637 | 427 | 285 | 209 | 186 | 245 | 286 | 512 | 847 |
| 1998 | 921 | 883 | 812 | 558 | 321 | 227 | 191 | 176 | 180 | 243 | 448 | 629 |
| 1999 | 1,040 | 957 | 1,015 | 646 | 355 | 220 | 185 | 162 | 183 | 310 | 396 | 651 |
| 2000 | 935 | 867 | 450 | 499 | 351 | 227 | 195 | 185 | 58 | 234 | 421 | 704 |
| 2001 | 1,045 | 869 | 919 | 605 | 285 | 221 | 184 | 160 | 185 | 290 | 396 | 522 |
| 2002 | 1,145 | 1,002 | 941 | 696 | 452 | 297 | 259 | 270 | 280 | 355 | 682 | 1,100 |
| 2003 | 1,534 | 1,426 | 1,012 | 727 | 440 | 343 | 303 | 282 | 311 | 422 | 644 | 995 |
| 2004 | 1,582 | 1,330 | 966 | 679 | 342 | 307 | 271 | 292 | 313 | 471 | 731 | 1,180 |
| 2005 | 1,358 | 1,253 | 1,198 | 572 | 424 | 291 | 272 | 289 | 294 | 433 | 702 | 1,297 |
| 2006 | 1,166 | 1,248 | 964 | 574 | 410 | 358 | 321 | 323 | 327 | 577 | 789 | 1,077 |
| 2007 | 1,174 | 1,473 | 1,098 | 718 | 413 | 384 | 307 | 320 | 319 | 420 | 816 | 1,185 |
| 2008 | 1,348 | 1,273 | 1,052 | 644 | 485 | 418 | 335 | 337 | 337 | 481 | 891 | 1,266 |
| 2009 | 1,935 | 1,455 | 1,290 | 813 | 566 | 521 | 528 | 519 | 571 | 826 | 991 | 1,670 |
| 2010 | 1,731 | 1,648 | 1,124 | 724 | 608 | 541 | 597 | 641 | 569 | 813 | 1,165 | 2,033 |
| 2011 | 1,883 | 1,393 | 1,217 | 700 | 532 | 397 | 365 | 438 | 455 | 719 | 976 | 1,402 |
| 2012 | 1,608 | 1,367 | 897 | 725 | 463 | 410 | 356 | 365 | 429 | 686 | 1,359 | 1,370 |
| 2013 | 1,722 | 1,592 | 1,435 | 665 | 481 | 372 | 364 | 405 | 461 | 740 | 1,305 | 1,627 |
| 2014 | 2,128 | 1,696 | 1,502 | 740 | 615 | 412 | 352 | 410 | 421 | 711 | 1,347 | 1,548 |
| 2015 | 2,031 | 2,097 | 1,504 | 770 | 422 | 429 | 393 | 429 | 453 | 852 | 1,117 | 1,234 |
| 2016 | 1,926 | 1,595 | 1,071 | 898 | 668 | 516 | 519 | 566 | 596 | 862 | 1,259 | 1,865 |
| 2017 | 1,874 | 1,495 | 1,683 | 746 | 716 | 558 | 496 | 570 | 648 | 831 | 1,455 | 2,310 |
| 2018 | 2,152 | 1,698 | 1,874 | 1,208 | 691 | 684 | 687 | 766 | 796 | 1,222 | 1,839 | 1,978 |
| 2019 | 2,396 | 1,871 | 1,826 | 886 | 808 | 713 | 762 | 744 | 758 | 978 | 1,838 | 2,008 |
| 2020 | 1,420 | 1,259 | 981 | 801 | 554 | 451 | 508 | 517 | 561 | 745 | 953 | 1,498 |
| 2021 | 1,681 | 1,580 | 1,042 | 1,063 | 473 | 383 | 404 | 415 | 439 | 558 | 1,344 | 1,238 |
| 2022 | 2,028 | 1,336 | 1,087 | 742 | 465 | 406 | 429 | 408 | 440 | 781 | 1,170 | 1,609 |
| 2023 | 1,360 | 1,196 | 1,227 | 621 | 516 | 413 | 419 | 437 | 464 | 714 | 1,335 | 1,338 |
| 2024 | 1,649 | |||||||||||
| - = No Data Reported; -- = Not Applicable; NA = Not Available; W = Withheld to avoid disclosure of individual company data. |
| Release Date: 3/29/2024 |
| Next Release Date: 4/30/2024 |