|
Download Data (XLS File) |
|
||||||||
|
||||||||
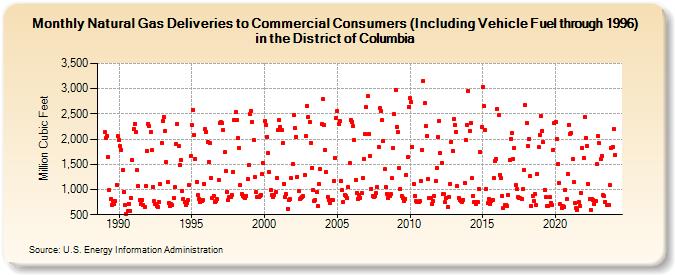
| Natural Gas Deliveries to Commercial Consumers (Including Vehicle Fuel through 1996) in the District of Columbia (Million Cubic Feet) | ||||||||
| Year | Jan | Feb | Mar | Apr | May | Jun | Jul | Aug | Sep | Oct | Nov | Dec |
|---|---|---|---|---|---|---|---|---|---|---|---|---|
| 1989 | 2,133 | 2,021 | 2,066 | 1,635 | 999 | 803 | 692 | 763 | 712 | 775 | 1,090 | 2,052 |
| 1990 | 1,986 | 1,857 | 1,789 | 1,384 | 951 | 699 | 514 | 572 | 721 | 574 | 836 | 1,589 |
| 1991 | 2,204 | 2,308 | 2,131 | 1,381 | 1,063 | 784 | 705 | 794 | 689 | 658 | 1,071 | 1,764 |
| 1992 | 2,300 | 2,256 | 2,132 | 1,774 | 1,056 | 764 | 718 | 673 | 653 | 753 | 1,103 | 1,921 |
| 1993 | 2,352 | 2,438 | 2,166 | 1,550 | 1,150 | 731 | 664 | 703 | 684 | 841 | 1,040 | 1,909 |
| 1994 | 2,303 | 1,865 | 1,483 | 1,588 | 979 | 815 | 753 | 692 | 740 | 785 | 1,082 | 1,658 |
| 1995 | 2,280 | 2,583 | 2,089 | 1,607 | 1,158 | 884 | 820 | 744 | 766 | 794 | 1,116 | 2,194 |
| 1996 | 2,147 | 1,942 | 1,551 | 1,925 | 1,233 | 824 | 878 | 750 | 774 | 804 | 1,195 | 2,325 |
| 1997 | 2,334 | 2,315 | 2,183 | 1,738 | 1,372 | 951 | 782 | 853 | 852 | 899 | 1,354 | 2,379 |
| 1998 | 2,537 | 2,376 | 2,028 | 1,824 | 1,080 | 909 | 867 | 843 | 833 | 879 | 1,205 | 1,480 |
| 1999 | 2,488 | 2,553 | 2,337 | 1,981 | 1,252 | 943 | 853 | 843 | 865 | 899 | 1,304 | 1,518 |
| 2000 | 2,353 | 2,287 | 2,047 | 1,716 | 1,345 | 983 | 887 | 857 | 889 | 955 | 1,236 | 2,174 |
| 2001 | 2,383 | 2,246 | 2,172 | 1,930 | 1,115 | 852 | 908 | 623 | 786 | 802 | 1,223 | 1,506 |
| 2002 | 2,473 | 2,223 | 2,047 | 1,257 | 977 | 803 | 831 | 845 | 864 | 1,283 | 2,064 | 2,663 |
| 2003 | 2,436 | 2,344 | 1,923 | 1,434 | 982 | 765 | 801 | 944 | 663 | 1,113 | 1,397 | 2,298 |
| 2004 | 2,798 | 2,272 | 1,785 | 1,345 | 857 | 783 | 740 | 794 | 791 | 1,172 | 1,630 | 2,416 |
| 2005 | 2,561 | 2,307 | 2,356 | 1,177 | 984 | 759 | 896 | 881 | 824 | 1,043 | 1,516 | 2,379 |
| 2006 | 2,341 | 2,250 | 1,983 | 1,195 | 933 | 812 | 889 | 837 | 928 | 1,232 | 1,609 | 2,098 |
| 2007 | 2,635 | 2,854 | 2,107 | 1,667 | 1,017 | 868 | 858 | 862 | 923 | 1,044 | 1,853 | 2,607 |
| 2008 | 2,552 | 2,377 | 1,971 | 1,398 | 1,046 | 920 | 840 | 862 | 906 | 1,225 | 1,821 | 2,493 |
| 2009 | 2,977 | 2,243 | 2,138 | 1,428 | 1,018 | 878 | 840 | 776 | 820 | 1,295 | 1,650 | 2,642 |
| 2010 | 2,810 | 2,727 | 1,842 | 1,119 | 877 | 767 | 754 | 759 | 773 | 1,177 | 1,789 | 3,153 |
| 2011 | 2,711 | 2,257 | 2,066 | 1,209 | 824 | 833 | 720 | 769 | 867 | 1,165 | 1,428 | 2,043 |
| 2012 | 2,367 | 1,722 | 1,532 | 901 | 902 | 748 | 837 | 662 | 854 | 1,115 | 1,951 | 1,772 |
| 2013 | 2,403 | 2,277 | 2,143 | 1,061 | 834 | 784 | 767 | 760 | 798 | 1,137 | 1,981 | 2,289 |
| 2014 | 2,961 | 2,169 | 2,325 | 1,224 | 877 | 744 | 703 | 752 | 745 | 1,007 | 1,747 | 2,242 |
| 2015 | 3,043 | 2,648 | 2,184 | 1,010 | 725 | 821 | 712 | 770 | 798 | 1,230 | 1,563 | 1,611 |
| 2016 | 2,596 | 2,469 | 1,297 | 1,222 | 877 | 639 | 688 | 699 | 675 | 898 | 1,577 | 2,011 |
| 2017 | 2,127 | 1,613 | 1,826 | 1,088 | 1,009 | 847 | 835 | 825 | 815 | 1,001 | 1,383 | 2,671 |
| 2018 | 2,324 | 1,865 | 2,008 | 1,267 | 681 | 873 | 771 | 909 | 693 | 1,314 | 1,837 | 2,082 |
| 2019 | 2,456 | 2,169 | 1,936 | 998 | 843 | 682 | 665 | 845 | 736 | 688 | 1,791 | 2,317 |
| 2020 | 2,345 | 1,999 | 1,514 | 1,137 | 706 | 638 | 676 | 660 | 990 | 807 | 1,311 | 2,289 |
| 2021 | 2,111 | 2,125 | 1,596 | 1,145 | 740 | 632 | 589 | 752 | 675 | 937 | 1,826 | 1,630 |
| 2022 | 2,447 | 2,017 | 1,860 | 1,117 | 808 | 600 | 802 | 787 | 712 | 778 | 1,499 | 2,062 |
| 2023 | 1,916 | 1,605 | 1,674 | 883 | 862 | 762 | 689 | 692 | 687 | 1,080 | 1,824 | 1,846 |
| 2024 | 2,205 | |||||||||||
| - = No Data Reported; -- = Not Applicable; NA = Not Available; W = Withheld to avoid disclosure of individual company data. |
| Release Date: 3/29/2024 |
| Next Release Date: 4/30/2024 |