|
Download Data (XLS File) |
|
||||||||
|
||||||||
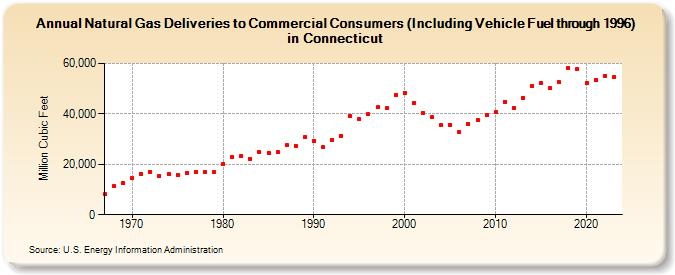
| Natural Gas Deliveries to Commercial Consumers (Including Vehicle Fuel through 1996) in Connecticut (Million Cubic Feet) | ||||||||
| Decade | Year-0 | Year-1 | Year-2 | Year-3 | Year-4 | Year-5 | Year-6 | Year-7 | Year-8 | Year-9 |
|---|---|---|---|---|---|---|---|---|---|---|
| 1960's | 8,109 | 11,224 | 12,435 | |||||||
| 1970's | 14,500 | 16,073 | 17,005 | 15,420 | 16,247 | 15,928 | 16,694 | 16,813 | 16,940 | 16,830 |
| 1980's | 20,153 | 22,769 | 23,125 | 22,260 | 24,778 | 24,590 | 24,713 | 27,581 | 27,411 | 30,781 |
| 1990's | 29,410 | 26,838 | 29,838 | 31,427 | 39,082 | 37,879 | 39,786 | 42,624 | 42,333 | 47,553 |
| 2000's | 48,476 | 44,378 | 40,535 | 38,760 | 35,511 | 35,756 | 32,660 | 35,963 | 37,666 | 39,731 |
| 2010's | 40,656 | 44,832 | 42,346 | 46,418 | 51,221 | 52,453 | 50,258 | 52,513 | 58,184 | 57,642 |
| 2020's | 52,185 | 53,529 | 55,112 | 54,572 |
| - = No Data Reported; -- = Not Applicable; NA = Not Available; W = Withheld to avoid disclosure of individual company data. |
| Release Date: 3/29/2024 |
| Next Release Date: 4/30/2024 |