|
Download Data (XLS File) |
|
||||||||
|
||||||||
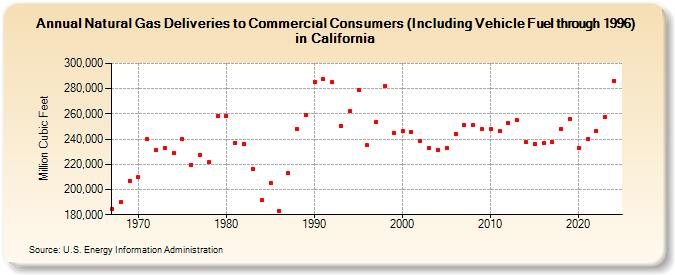
| Natural Gas Deliveries to Commercial Consumers (Including Vehicle Fuel through 1996) in California (Million Cubic Feet) | ||||||||
| Decade | Year-0 | Year-1 | Year-2 | Year-3 | Year-4 | Year-5 | Year-6 | Year-7 | Year-8 | Year-9 |
|---|---|---|---|---|---|---|---|---|---|---|
| 1960's | 184,630 | 189,903 | 206,861 | |||||||
| 1970's | 209,945 | 239,685 | 231,536 | 232,774 | 228,988 | 240,239 | 219,840 | 227,543 | 221,441 | 258,490 |
| 1980's | 258,151 | 236,910 | 236,202 | 215,918 | 191,838 | 205,044 | 182,794 | 212,904 | 248,397 | 259,118 |
| 1990's | 285,090 | 287,608 | 285,008 | 250,283 | 261,989 | 278,761 | 235,068 | 253,923 | 282,153 | 244,701 |
| 2000's | 246,439 | 245,795 | 238,308 | 232,912 | 231,597 | 233,082 | 244,432 | 251,024 | 251,045 | 247,775 |
| 2010's | 247,997 | 246,141 | 253,148 | 254,845 | 237,675 | 235,791 | 236,967 | 237,352 | 248,012 | 255,981 |
| 2020's | 232,642 | 240,019 | 246,624 | 252,301 |
| - = No Data Reported; -- = Not Applicable; NA = Not Available; W = Withheld to avoid disclosure of individual company data. |
| Release Date: 3/29/2024 |
| Next Release Date: 4/30/2024 |