|
Download Data (XLS File) |
|
||||||||
|
||||||||
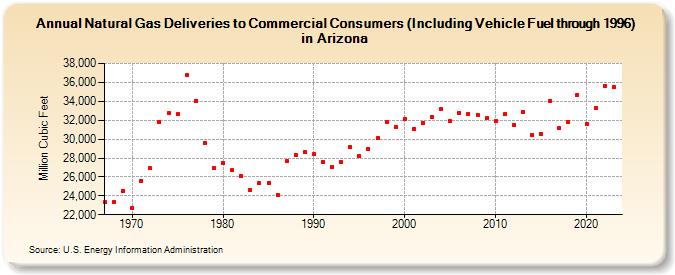
| Natural Gas Deliveries to Commercial Consumers (Including Vehicle Fuel through 1996) in Arizona (Million Cubic Feet) | ||||||||
| Decade | Year-0 | Year-1 | Year-2 | Year-3 | Year-4 | Year-5 | Year-6 | Year-7 | Year-8 | Year-9 |
|---|---|---|---|---|---|---|---|---|---|---|
| 1960's | 23,335 | 23,389 | 24,501 | |||||||
| 1970's | 22,705 | 25,604 | 26,905 | 31,812 | 32,742 | 32,638 | 36,763 | 34,076 | 29,581 | 26,971 |
| 1980's | 27,487 | 26,742 | 26,085 | 24,612 | 25,309 | 25,360 | 24,081 | 27,669 | 28,299 | 28,600 |
| 1990's | 28,401 | 27,597 | 27,089 | 27,568 | 29,187 | 28,210 | 28,987 | 30,132 | 31,788 | 31,301 |
| 2000's | 32,138 | 31,121 | 31,705 | 32,292 | 33,159 | 31,888 | 32,792 | 32,694 | 32,516 | 32,196 |
| 2010's | 31,945 | 32,633 | 31,530 | 32,890 | 30,456 | 30,536 | 34,010 | 31,212 | 31,812 | 34,687 |
| 2020's | 31,605 | 33,279 | 35,636 | 35,478 |
| - = No Data Reported; -- = Not Applicable; NA = Not Available; W = Withheld to avoid disclosure of individual company data. |
| Release Date: 3/29/2024 |
| Next Release Date: 4/30/2024 |