|
Download Data (XLS File) |
|
||||||||
|
||||||||
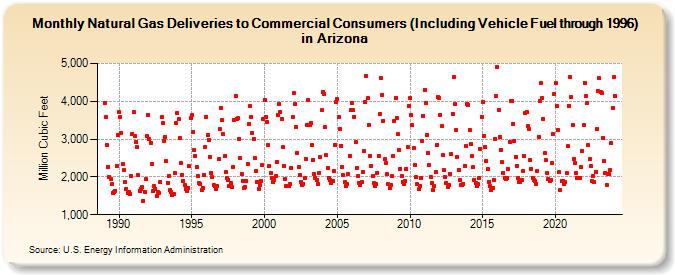
| Natural Gas Deliveries to Commercial Consumers (Including Vehicle Fuel through 1996) in Arizona (Million Cubic Feet) | ||||||||
| Year | Jan | Feb | Mar | Apr | May | Jun | Jul | Aug | Sep | Oct | Nov | Dec |
|---|---|---|---|---|---|---|---|---|---|---|---|---|
| 1989 | 3,945 | 3,572 | 2,845 | 2,275 | 1,994 | 1,951 | 1,805 | 1,579 | 1,597 | 1,634 | 2,296 | 3,108 |
| 1990 | 3,706 | 3,577 | 3,165 | 2,338 | 2,174 | 1,854 | 1,686 | 1,580 | 1,610 | 1,555 | 2,018 | 3,139 |
| 1991 | 3,716 | 3,091 | 2,935 | 2,785 | 2,039 | 1,637 | 1,669 | 1,722 | 1,375 | 1,609 | 1,941 | 3,077 |
| 1992 | 3,647 | 3,011 | 2,898 | 2,352 | 1,620 | 1,754 | 1,690 | 1,505 | 1,601 | 1,580 | 1,858 | 3,573 |
| 1993 | 3,422 | 2,954 | 3,056 | 2,408 | 1,851 | 2,035 | 1,654 | 1,601 | 1,521 | 1,551 | 2,100 | 3,416 |
| 1994 | 3,689 | 3,522 | 3,028 | 2,365 | 2,057 | 1,887 | 1,784 | 1,690 | 1,621 | 1,717 | 2,279 | 3,548 |
| 1995 | 3,637 | 3,181 | 2,703 | 2,556 | 2,251 | 2,014 | 1,840 | 1,817 | 1,652 | 1,702 | 2,056 | 2,802 |
| 1996 | 3,587 | 3,107 | 2,984 | 2,532 | 2,110 | 1,987 | 1,779 | 1,753 | 1,680 | 1,748 | 2,461 | 3,259 |
| 1997 | 3,833 | 3,502 | 3,132 | 2,546 | 2,127 | 1,963 | 1,927 | 1,759 | 1,827 | 1,742 | 2,258 | 3,515 |
| 1998 | 4,130 | 3,535 | 3,549 | 3,011 | 2,494 | 2,073 | 1,899 | 1,719 | 1,738 | 1,900 | 2,352 | 3,388 |
| 1999 | 3,873 | 3,583 | 3,170 | 2,994 | 2,495 | 2,143 | 1,875 | 1,676 | 1,781 | 1,886 | 2,302 | 3,523 |
| 2000 | 4,035 | 3,593 | 3,444 | 2,836 | 2,294 | 2,113 | 1,959 | 1,877 | 1,914 | 2,020 | 2,403 | 3,650 |
| 2001 | 3,934 | 3,716 | 3,543 | 2,778 | 2,289 | 1,947 | 1,763 | 1,747 | 1,771 | 1,819 | 2,240 | 3,574 |
| 2002 | 4,212 | 3,920 | 3,323 | 2,642 | 2,257 | 2,050 | 1,874 | 1,795 | 1,820 | 1,963 | 2,471 | 3,380 |
| 2003 | 4,039 | 3,373 | 3,422 | 2,852 | 2,457 | 2,068 | 1,980 | 1,907 | 1,815 | 2,104 | 2,516 | 3,759 |
| 2004 | 4,245 | 4,202 | 3,310 | 2,570 | 2,239 | 1,973 | 1,922 | 1,835 | 1,879 | 2,150 | 2,853 | 3,981 |
| 2005 | 4,056 | 3,578 | 3,264 | 2,828 | 2,274 | 2,050 | 1,865 | 1,760 | 1,815 | 2,069 | 2,565 | 3,764 |
| 2006 | 3,966 | 3,764 | 3,597 | 2,928 | 2,245 | 2,021 | 1,844 | 1,773 | 1,860 | 2,130 | 2,686 | 3,978 |
| 2007 | 4,679 | 4,078 | 3,377 | 2,561 | 2,287 | 2,011 | 1,826 | 1,752 | 1,807 | 2,109 | 2,541 | 3,666 |
| 2008 | 4,609 | 4,176 | 3,489 | 2,465 | 2,379 | 2,069 | 1,802 | 1,701 | 1,790 | 2,026 | 2,541 | 3,470 |
| 2009 | 4,082 | 3,568 | 3,126 | 2,724 | 2,222 | 2,028 | 1,872 | 1,822 | 1,882 | 2,212 | 2,778 | 3,879 |
| 2010 | 4,083 | 3,632 | 3,361 | 2,754 | 2,326 | 1,993 | 1,807 | 1,672 | 1,766 | 1,984 | 2,952 | 3,616 |
| 2011 | 4,299 | 3,956 | 3,112 | 2,634 | 2,313 | 2,002 | 1,835 | 1,652 | 1,747 | 2,125 | 2,848 | 4,111 |
| 2012 | 4,090 | 3,645 | 3,336 | 2,576 | 2,171 | 1,987 | 1,845 | 1,740 | 1,792 | 2,081 | 2,601 | 3,668 |
| 2013 | 4,648 | 3,923 | 3,250 | 2,517 | 2,191 | 1,925 | 1,791 | 1,795 | 1,822 | 2,291 | 2,811 | 3,927 |
| 2014 | 3,915 | 3,234 | 2,866 | 2,546 | 2,260 | 1,931 | 1,843 | 1,750 | 1,806 | 1,968 | 2,749 | 3,589 |
| 2015 | 3,981 | 3,083 | 2,786 | 2,422 | 2,204 | 1,878 | 1,758 | 1,651 | 1,709 | 1,918 | 3,015 | 4,131 |
| 2016 | 4,918 | 3,762 | 3,066 | 2,723 | 2,397 | 2,114 | 1,960 | 1,947 | 1,984 | 2,197 | 2,925 | 4,017 |
| 2017 | 4,004 | 3,408 | 2,946 | 2,539 | 2,288 | 1,969 | 1,865 | 1,875 | 1,917 | 2,167 | 2,551 | 3,681 |
| 2018 | 3,711 | 3,337 | 3,269 | 2,448 | 2,214 | 1,977 | 1,930 | 1,881 | 1,820 | 2,163 | 3,051 | 4,013 |
| 2019 | 4,477 | 4,086 | 3,536 | 2,630 | 2,434 | 2,093 | 1,949 | 1,887 | 1,911 | 2,378 | 3,122 | 4,183 |
| 2020 | 4,472 | 3,881 | 3,252 | 2,124 | 1,642 | 1,887 | 1,903 | 1,805 | 1,856 | 2,093 | 2,809 | 3,882 |
| 2021 | 4,645 | 4,108 | 3,379 | 2,467 | 2,356 | 2,102 | 1,959 | 1,963 | 1,977 | 2,269 | 2,691 | 3,364 |
| 2022 | 4,493 | 4,127 | 3,966 | 2,838 | 2,464 | 2,278 | 1,890 | 2,030 | 1,874 | 2,131 | 3,276 | 4,269 |
| 2023 | 4,603 | 4,255 | 4,210 | 3,030 | 2,420 | 2,111 | 1,798 | 2,076 | 2,081 | 2,172 | 2,890 | 3,832 |
| 2024 | 4,648 | |||||||||||
| - = No Data Reported; -- = Not Applicable; NA = Not Available; W = Withheld to avoid disclosure of individual company data. |
| Release Date: 3/29/2024 |
| Next Release Date: 4/30/2024 |