|
Download Data (XLS File) |
|
||||||||
|
||||||||
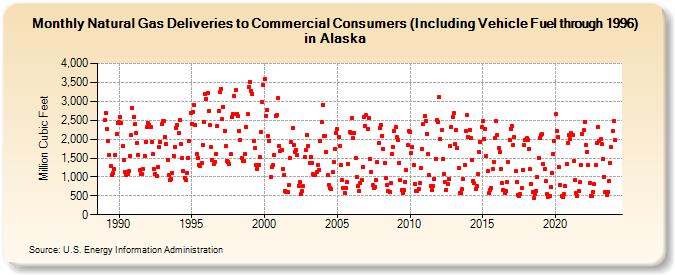
| Natural Gas Deliveries to Commercial Consumers (Including Vehicle Fuel through 1996) in Alaska (Million Cubic Feet) | ||||||||
| Year | Jan | Feb | Mar | Apr | May | Jun | Jul | Aug | Sep | Oct | Nov | Dec |
|---|---|---|---|---|---|---|---|---|---|---|---|---|
| 1989 | 2,500 | 2,691 | 2,258 | 1,949 | 1,569 | 1,287 | 1,042 | 1,091 | 1,202 | 1,577 | 2,144 | 2,429 |
| 1990 | 2,447 | 2,584 | 2,429 | 1,809 | 1,456 | 1,134 | 1,061 | 1,077 | 1,148 | 1,554 | 2,106 | 2,818 |
| 1991 | 2,579 | 2,388 | 2,149 | 1,896 | 1,576 | 1,171 | 1,069 | 1,073 | 1,198 | 1,561 | 1,930 | 2,308 |
| 1992 | 2,414 | 2,372 | 2,319 | 1,935 | 1,597 | 1,206 | 1,084 | 1,013 | 1,252 | 1,790 | 1,928 | 2,390 |
| 1993 | 2,487 | 2,471 | 2,051 | 1,863 | 1,441 | 1,055 | 917 | 957 | 1,112 | 1,563 | 1,785 | 2,301 |
| 1994 | 2,367 | 2,156 | 2,504 | 1,868 | 1,489 | 1,161 | 981 | 919 | 1,105 | 1,508 | 1,937 | 2,702 |
| 1995 | 2,412 | 2,727 | 2,896 | 2,362 | 1,603 | 1,489 | 1,325 | 1,301 | 1,366 | 1,846 | 2,461 | 3,190 |
| 1996 | 3,064 | 3,227 | 2,748 | 2,364 | 1,789 | 1,458 | 1,337 | 1,396 | 1,617 | 2,337 | 2,743 | 3,236 |
| 1997 | 3,335 | 2,529 | 2,861 | 2,225 | 1,813 | 1,428 | 1,404 | 1,340 | 1,594 | 2,574 | 2,658 | 3,147 |
| 1998 | 3,286 | 2,674 | 2,604 | 2,222 | 1,976 | 1,511 | 1,415 | 1,414 | 1,619 | 2,318 | 2,668 | 3,372 |
| 1999 | 3,517 | 3,275 | 3,197 | 1,960 | 1,756 | 1,324 | 1,211 | 1,309 | 1,517 | 2,181 | 2,993 | 3,427 |
| 2000 | 3,592 | 2,619 | 2,762 | 2,095 | 1,951 | 988 | 1,253 | 1,311 | 1,573 | 2,624 | 2,642 | 3,075 |
| 2001 | 1,827 | 1,690 | 1,710 | 1,221 | 1,050 | 640 | 603 | 610 | 789 | 1,499 | 1,911 | 2,299 |
| 2002 | 1,839 | 1,665 | 1,705 | 1,572 | 768 | 858 | 547 | 627 | 750 | 1,532 | 1,707 | 2,120 |
| 2003 | 1,815 | 1,368 | 1,539 | 1,363 | 1,065 | 1,052 | 1,060 | 1,124 | 1,312 | 1,186 | 1,938 | 2,447 |
| 2004 | 2,914 | 2,081 | 2,091 | 1,664 | 1,046 | 797 | 697 | 676 | 1,123 | 1,387 | 1,743 | 2,154 |
| 2005 | 2,263 | 2,062 | 1,815 | 1,317 | 912 | 719 | 570 | 705 | 857 | 1,340 | 2,176 | 2,165 |
| 2006 | 2,547 | 2,022 | 2,155 | 1,504 | 1,003 | 748 | 616 | 828 | 924 | 1,263 | 2,580 | 2,353 |
| 2007 | 2,626 | 2,262 | 2,553 | 1,486 | 1,117 | 781 | 704 | 737 | 922 | 1,391 | 1,893 | 2,284 |
| 2008 | 2,386 | 2,092 | 1,742 | 1,380 | 976 | 796 | 617 | 591 | 831 | 1,617 | 1,792 | 2,205 |
| 2009 | 2,323 | 2,054 | 1,978 | 1,381 | 911 | 662 | 573 | 647 | 875 | 1,179 | 1,832 | 2,206 |
| 2010 | 2,197 | 1,639 | 1,791 | 1,321 | 821 | 636 | 615 | 685 | 828 | 1,245 | 1,734 | 2,408 |
| 2011 | 2,603 | 2,487 | 2,138 | 1,598 | 1,039 | 760 | 647 | 760 | 945 | 1,472 | 2,502 | 2,449 |
| 2012 | 3,107 | 2,000 | 2,228 | 1,471 | 1,084 | 853 | 664 | 820 | 952 | 1,813 | 2,318 | 2,587 |
| 2013 | 2,682 | 1,860 | 2,242 | 1,753 | 1,244 | 577 | 562 | 668 | 943 | 1,314 | 2,222 | 2,629 |
| 2014 | 2,055 | 2,249 | 2,030 | 1,451 | 902 | 829 | 667 | 758 | 1,081 | 1,662 | 1,932 | 2,307 |
| 2015 | 2,473 | 1,992 | 2,268 | 1,548 | 1,147 | 574 | 662 | 717 | 1,202 | 1,393 | 2,028 | 2,469 |
| 2016 | 2,110 | 1,753 | 1,664 | 1,201 | 826 | 664 | 566 | 639 | 866 | 1,400 | 1,986 | 2,277 |
| 2017 | 2,342 | 1,857 | 2,052 | 1,153 | 855 | 530 | 500 | 550 | 709 | 1,189 | 1,831 | 1,977 |
| 2018 | 2,021 | 1,968 | 1,739 | 1,197 | 819 | 593 | 438 | 558 | 636 | 993 | 1,509 | 2,017 |
| 2019 | 2,111 | 2,134 | 1,334 | 1,219 | 881 | 539 | 471 | 495 | 721 | 1,109 | 1,609 | 1,947 |
| 2020 | 2,653 | 2,216 | 2,045 | 1,275 | 786 | 491 | 470 | 559 | 749 | 1,340 | 1,897 | 2,116 |
| 2021 | 1,994 | 2,153 | 2,118 | 1,426 | 909 | 563 | 491 | 616 | 857 | 1,316 | 2,136 | 2,239 |
| 2022 | 2,462 | 1,852 | 1,668 | 1,303 | 836 | 504 | 490 | 595 | 802 | 1,308 | 1,901 | 2,332 |
| 2023 | 1,955 | 1,991 | 1,868 | 1,479 | 1,008 | 608 | 531 | 609 | 886 | 1,378 | 1,781 | 2,206 |
| 2024 | 2,476 | |||||||||||
| - = No Data Reported; -- = Not Applicable; NA = Not Available; W = Withheld to avoid disclosure of individual company data. |
| Release Date: 3/29/2024 |
| Next Release Date: 4/30/2024 |