|
Download Data (XLS File) |
|
||||||||
|
||||||||
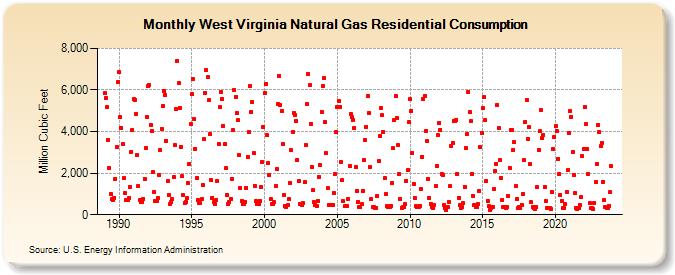
| West Virginia Natural Gas Residential Consumption (Million Cubic Feet) | ||||||||
| Year | Jan | Feb | Mar | Apr | May | Jun | Jul | Aug | Sep | Oct | Nov | Dec |
|---|---|---|---|---|---|---|---|---|---|---|---|---|
| 1989 | 5,838 | 5,621 | 5,179 | 3,608 | 2,263 | 1,001 | 741 | 695 | 824 | 1,738 | 3,240 | 6,382 |
| 1990 | 6,858 | 4,690 | 4,174 | 3,403 | 1,747 | 1,055 | 724 | 696 | 800 | 1,353 | 3,031 | 4,069 |
| 1991 | 5,561 | 5,527 | 4,858 | 2,876 | 1,372 | 707 | 629 | 622 | 765 | 1,738 | 3,210 | 4,722 |
| 1992 | 6,183 | 6,231 | 4,328 | 4,038 | 2,076 | 1,105 | 683 | 661 | 819 | 1,899 | 3,120 | 4,146 |
| 1993 | 5,220 | 5,960 | 5,767 | 3,560 | 1,608 | 962 | 533 | 620 | 740 | 1,818 | 3,347 | 5,072 |
| 1994 | 7,397 | 6,344 | 5,136 | 3,281 | 1,841 | 926 | 541 | 625 | 789 | 1,511 | 2,462 | 4,348 |
| 1995 | 5,783 | 6,546 | 4,592 | 3,173 | 1,776 | 702 | 574 | 560 | 740 | 1,441 | 3,626 | 5,867 |
| 1996 | 6,958 | 6,602 | 5,495 | 3,877 | 1,652 | 817 | 590 | 537 | 696 | 1,609 | 3,391 | 5,166 |
| 1997 | 5,908 | 5,572 | 4,273 | 3,386 | 2,223 | 952 | 492 | 598 | 776 | 1,737 | 4,061 | 6,017 |
| 1998 | 5,676 | 4,894 | 4,540 | 2,879 | 1,278 | 670 | 513 | 526 | 623 | 1,300 | 2,791 | 3,974 |
| 1999 | 6,202 | 4,957 | 5,443 | 2,957 | 1,398 | 657 | 527 | 505 | 681 | 1,339 | 2,541 | 4,195 |
| 2000 | 5,832 | 6,279 | 3,818 | 2,491 | 1,898 | 747 | 520 | 535 | 599 | 1,372 | 2,177 | 5,331 |
| 2001 | 6,696 | 5,275 | 4,997 | 3,394 | 963 | 442 | 386 | 448 | 752 | 1,527 | 3,089 | 3,970 |
| 2002 | 4,915 | 4,814 | 4,528 | 2,641 | 1,609 | 533 | 537 | 448 | 549 | 1,556 | 3,357 | 5,306 |
| 2003 | 6,785 | 6,223 | 4,385 | 2,285 | 1,171 | 600 | 477 | 443 | 680 | 1,816 | 2,379 | 4,964 |
| 2004 | 6,178 | 6,569 | 4,455 | 2,958 | 1,262 | 484 | 486 | 449 | 491 | 1,065 | 1,959 | 3,974 |
| 2005 | 5,162 | 5,469 | 5,157 | 2,534 | 1,660 | 636 | 399 | 396 | 419 | 756 | 2,339 | 4,868 |
| 2006 | 4,679 | 4,570 | 4,193 | 2,280 | 1,145 | 618 | 355 | 365 | 500 | 1,159 | 2,623 | 3,597 |
| 2007 | 4,242 | 5,694 | 4,898 | 2,305 | 736 | 355 | 363 | 331 | 343 | 889 | 2,568 | 3,806 |
| 2008 | 5,137 | 4,779 | 3,983 | 1,765 | 993 | 425 | 364 | 369 | 440 | 1,519 | 3,186 | 4,557 |
| 2009 | 5,706 | 4,672 | 3,336 | 1,937 | 755 | 340 | 370 | 348 | 503 | 1,636 | 2,128 | 4,442 |
| 2010 | 5,549 | 5,003 | 2,971 | 1,496 | 807 | 399 | 350 | 387 | 436 | 1,239 | 2,796 | 5,587 |
| 2011 | 5,695 | 4,049 | 3,538 | 1,740 | 801 | 523 | 363 | 333 | 462 | 1,374 | 2,362 | 3,832 |
| 2012 | 4,430 | 4,096 | 1,961 | 1,907 | 458 | 327 | 233 | 379 | 631 | 1,363 | 3,300 | 3,454 |
| 2013 | 4,530 | 4,486 | 4,560 | 1,982 | 824 | 467 | 331 | 362 | 549 | 1,356 | 3,198 | 3,870 |
| 2014 | 5,909 | 4,950 | 4,484 | 1,972 | 913 | 466 | 360 | 360 | 517 | 1,147 | 3,249 | 3,929 |
| 2015 | 5,121 | 5,640 | 4,563 | 1,631 | 668 | 416 | 243 | 337 | 385 | 1,235 | 2,120 | 2,449 |
| 2016 | 5,275 | 4,160 | 2,617 | 1,784 | 726 | 371 | 363 | 323 | 360 | 884 | 2,265 | 4,083 |
| 2017 | 4,081 | 3,118 | 3,489 | 1,372 | 758 | 325 | 356 | 304 | 485 | 1,014 | 2,610 | 4,473 |
| 2018 | 5,522 | 3,644 | 4,242 | 2,439 | 592 | 385 | 330 | 297 | 348 | 1,311 | 3,135 | 4,011 |
| 2019 | 5,016 | 3,677 | 3,842 | 1,355 | 654 | 314 | 331 | 343 | 297 | 1,089 | 3,172 | 3,758 |
| 2020 | 4,261 | 4,023 | 2,684 | 1,948 | 949 | 675 | 325 | 318 | 505 | 1,081 | 2,144 | 3,939 |
| 2021 | 4,976 | 4,715 | 2,999 | 1,918 | 1,050 | 314 | 264 | 301 | 459 | 830 | 2,811 | 3,180 |
| 2022 | 5,182 | 4,340 | 3,164 | 1,972 | 563 | 319 | 338 | 277 | 552 | 1,571 | 2,446 | 4,324 |
| 2023 | 3,970 | 3,299 | 3,450 | 1,595 | 698 | 377 | 305 | 319 | 421 | 1,070 | 2,328 | NA |
| 2024 | NA | |||||||||||
| - = No Data Reported; -- = Not Applicable; NA = Not Available; W = Withheld to avoid disclosure of individual company data. |
| Release Date: 3/29/2024 |
| Next Release Date: 4/30/2024 |