|
Download Data (XLS File) |
|
||||||||
|
||||||||
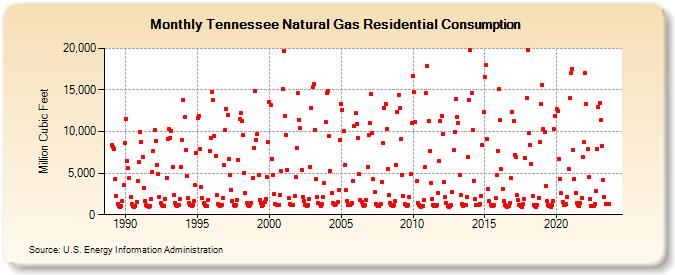
| Tennessee Natural Gas Residential Consumption (Million Cubic Feet) | ||||||||
| Year | Jan | Feb | Mar | Apr | May | Jun | Jul | Aug | Sep | Oct | Nov | Dec |
|---|---|---|---|---|---|---|---|---|---|---|---|---|
| 1989 | 8,323 | 8,151 | 7,961 | 4,311 | 2,220 | 1,347 | 1,041 | 961 | 1,044 | 1,683 | 3,555 | 8,601 |
| 1990 | 11,556 | 6,514 | 5,575 | 4,407 | 2,119 | 1,304 | 993 | 963 | 1,017 | 1,582 | 4,018 | 6,293 |
| 1991 | 9,950 | 8,803 | 6,940 | 3,245 | 1,629 | 1,128 | 1,034 | 961 | 1,069 | 1,898 | 5,085 | 7,616 |
| 1992 | 10,132 | 8,849 | 6,002 | 4,859 | 2,186 | 1,437 | 1,120 | 1,051 | 1,100 | 1,885 | 4,473 | 9,125 |
| 1993 | 10,319 | 9,273 | 10,041 | 5,755 | 2,317 | 1,365 | 1,109 | 1,011 | 1,111 | 1,839 | 5,774 | 9,003 |
| 1994 | 13,829 | 11,693 | 7,753 | 4,606 | 2,027 | 1,350 | 1,133 | 1,081 | 1,145 | 1,668 | 3,570 | 7,480 |
| 1995 | 11,673 | 11,830 | 7,907 | 3,361 | 2,007 | 1,350 | 1,149 | 1,054 | 1,065 | 1,801 | 7,624 | 9,171 |
| 1996 | 14,796 | 13,801 | 9,516 | 7,058 | 2,355 | 1,327 | 1,166 | 1,101 | 1,190 | 1,987 | 5,949 | 10,177 |
| 1997 | 12,717 | 11,997 | 6,666 | 4,776 | 3,007 | 1,652 | 1,115 | 1,075 | 1,182 | 1,829 | 6,602 | 11,511 |
| 1998 | 12,233 | 11,323 | 9,552 | 4,992 | 2,586 | 1,397 | 1,164 | 1,093 | 1,159 | 1,447 | 4,397 | 8,043 |
| 1999 | 14,847 | 8,993 | 9,699 | 4,777 | 1,809 | 1,428 | 1,070 | 1,167 | 1,539 | 1,909 | 4,521 | 8,802 |
| 2000 | 13,569 | 13,170 | 6,748 | 4,825 | 2,531 | 1,319 | 1,198 | 1,112 | 1,224 | 2,384 | 5,209 | 15,140 |
| 2001 | 19,716 | 11,916 | 9,553 | 5,382 | 1,981 | 1,295 | 1,139 | 1,125 | 1,228 | 2,198 | 4,509 | 8,012 |
| 2002 | 14,576 | 11,396 | 10,380 | 5,414 | 2,096 | 1,623 | 1,201 | 1,094 | 1,144 | 1,852 | 5,751 | 12,804 |
| 2003 | 15,336 | 15,713 | 10,227 | 4,288 | 2,146 | 1,436 | 1,251 | 1,074 | 1,250 | 2,092 | 3,826 | 11,108 |
| 2004 | 14,597 | 14,823 | 9,500 | 5,266 | 2,645 | 1,387 | 1,258 | 1,182 | 1,267 | 1,537 | 2,921 | 8,948 |
| 2005 | 13,370 | 12,627 | 10,024 | 5,979 | 2,939 | 1,640 | 1,197 | 1,122 | 1,258 | 1,438 | 4,052 | 10,630 |
| 2006 | 12,251 | 10,927 | 9,273 | 4,846 | 1,795 | 1,485 | 1,167 | 1,068 | 1,128 | 1,775 | 5,685 | 9,618 |
| 2007 | 11,015 | 14,465 | 9,852 | 4,286 | 2,674 | 1,299 | 1,154 | 1,084 | 1,057 | 1,304 | 3,910 | 8,636 |
| 2008 | 12,843 | 13,285 | 10,359 | 5,456 | 2,380 | 1,406 | 1,149 | 1,077 | 1,185 | 1,678 | 6,030 | 12,335 |
| 2009 | 14,421 | 12,835 | 9,054 | 4,787 | 2,210 | 1,271 | 1,183 | 1,082 | 1,202 | 2,185 | 4,862 | 11,018 |
| 2010 | 16,697 | 14,701 | 11,128 | 4,022 | 1,468 | 1,206 | 1,036 | 956 | 1,043 | 1,742 | 5,688 | 14,629 |
| 2011 | 17,826 | 11,229 | 7,676 | 3,858 | 1,944 | 1,205 | 992 | 1,004 | 1,148 | 2,633 | 6,407 | 11,269 |
| 2012 | 11,922 | 9,668 | 3,986 | 2,149 | 1,431 | 1,079 | 975 | 1,019 | 1,146 | 2,728 | 7,744 | 9,963 |
| 2013 | 13,889 | 11,719 | 11,085 | 4,774 | 2,394 | 1,259 | 1,107 | 1,115 | 1,117 | 2,092 | 6,931 | 13,758 |
| 2014 | 19,749 | 14,673 | 10,222 | 4,088 | 1,868 | 1,191 | 1,152 | 1,163 | 1,239 | 2,308 | 8,372 | 12,369 |
| 2015 | 16,604 | 18,022 | 9,122 | 3,088 | 1,606 | 1,202 | 1,033 | 995 | 1,155 | 1,967 | 4,811 | 7,708 |
| 2016 | 15,073 | 11,341 | 5,466 | 3,107 | 1,627 | 1,157 | 1,004 | 926 | 1,020 | 1,410 | 4,391 | 12,402 |
| 2017 | 11,248 | 7,217 | 6,888 | 2,363 | 1,721 | 1,168 | 1,008 | 983 | 1,253 | 1,899 | 6,831 | 14,083 |
| 2018 | 19,824 | 9,777 | 8,418 | 6,088 | 2,217 | 1,216 | 1,105 | 931 | 1,130 | 2,056 | 8,687 | 13,352 |
| 2019 | 15,593 | 10,307 | 9,987 | 3,423 | 1,608 | 1,193 | 1,107 | 915 | 1,146 | 1,702 | 10,251 | 11,857 |
| 2020 | 12,756 | 12,428 | 6,759 | 4,325 | 2,619 | 1,517 | 1,168 | 1,130 | 1,262 | 2,113 | 5,552 | 13,978 |
| 2021 | 17,056 | 17,567 | 7,728 | 4,295 | 2,561 | 1,387 | 1,200 | 1,012 | 1,370 | 1,951 | 6,903 | 8,685 |
| 2022 | 17,019 | 13,320 | 7,908 | 4,506 | 1,899 | 1,099 | 1,035 | 1,093 | 1,303 | 2,829 | 7,949 | 12,903 |
| 2023 | 13,408 | 11,393 | 8,213 | 4,122 | 2,139 | 1,322 | 1,342 | 1,293 | 1,303 | NA | NA | NA |
| 2024 | NA | |||||||||||
| - = No Data Reported; -- = Not Applicable; NA = Not Available; W = Withheld to avoid disclosure of individual company data. |
| Release Date: 3/29/2024 |
| Next Release Date: 4/30/2024 |