|
Download Data (XLS File) |
|
||||||||
|
||||||||
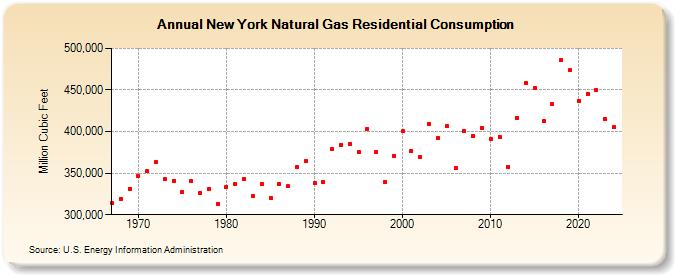
| New York Natural Gas Residential Consumption (Million Cubic Feet) | ||||||||
| Decade | Year-0 | Year-1 | Year-2 | Year-3 | Year-4 | Year-5 | Year-6 | Year-7 | Year-8 | Year-9 |
|---|---|---|---|---|---|---|---|---|---|---|
| 1960's | 313,656 | 319,282 | 331,326 | |||||||
| 1970's | 346,533 | 352,085 | 363,412 | 342,608 | 341,032 | 327,384 | 339,949 | 325,603 | 330,968 | 313,027 |
| 1980's | 333,902 | 336,813 | 343,029 | 321,949 | 337,253 | 320,073 | 336,712 | 334,417 | 357,260 | 364,713 |
| 1990's | 337,988 | 338,892 | 378,689 | 384,216 | 385,408 | 375,005 | 403,264 | 375,641 | 339,512 | 370,711 |
| 2000's | 400,224 | 376,176 | 369,614 | 409,649 | 392,738 | 406,175 | 356,453 | 400,259 | 394,196 | 404,868 |
| 2010's | 390,491 | 393,825 | 357,709 | 416,357 | 458,313 | 452,166 | 412,467 | 432,566 | 485,693 | 473,617 |
| 2020's | 437,122 | 445,564 | 449,772 | 403,158 |
| - = No Data Reported; -- = Not Applicable; NA = Not Available; W = Withheld to avoid disclosure of individual company data. |
| Release Date: 3/29/2024 |
| Next Release Date: 4/30/2024 |