|
Download Data (XLS File) |
|
||||||||
|
||||||||
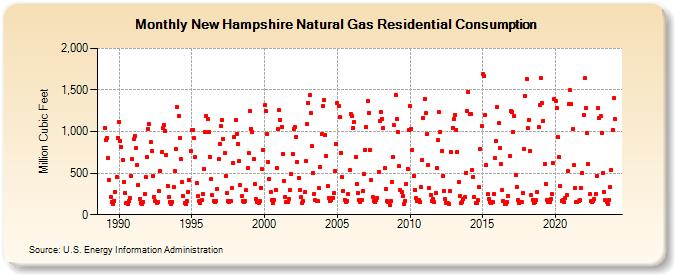
| New Hampshire Natural Gas Residential Consumption (Million Cubic Feet) | ||||||||
| Year | Jan | Feb | Mar | Apr | May | Jun | Jul | Aug | Sep | Oct | Nov | Dec |
|---|---|---|---|---|---|---|---|---|---|---|---|---|
| 1989 | 1,044 | 904 | 926 | 686 | 422 | 210 | 155 | 127 | 169 | 274 | 448 | 926 |
| 1990 | 1,118 | 890 | 815 | 655 | 395 | 262 | 145 | 128 | 162 | 203 | 465 | 665 |
| 1991 | 905 | 943 | 799 | 599 | 359 | 189 | 141 | 127 | 156 | 249 | 453 | 690 |
| 1992 | 1,032 | 1,089 | 869 | 766 | 461 | 219 | 159 | 139 | 151 | 288 | 526 | 750 |
| 1993 | 1,048 | 1,081 | 1,009 | 721 | 349 | 211 | 149 | 124 | 155 | 328 | 528 | 790 |
| 1994 | 1,294 | 1,187 | 925 | 665 | 391 | 222 | 136 | 126 | 170 | 275 | 419 | 762 |
| 1995 | 1,013 | 1,024 | 917 | 688 | 376 | 225 | 160 | 135 | 175 | 254 | 550 | 991 |
| 1996 | 1,193 | 1,147 | 998 | 698 | 426 | 233 | 159 | 155 | 169 | 312 | 667 | 855 |
| 1997 | 1,061 | 1,136 | 913 | 744 | 465 | 263 | 160 | 155 | 165 | 327 | 616 | 933 |
| 1998 | 1,140 | 974 | 853 | 643 | 355 | 220 | 169 | 156 | 159 | 294 | 566 | 739 |
| 1999 | 1,246 | 1,036 | 991 | 672 | 367 | 188 | 152 | 141 | 161 | 325 | 549 | 783 |
| 2000 | 1,316 | 1,242 | 973 | 632 | 432 | 275 | 178 | 143 | 182 | 302 | 566 | 1,033 |
| 2001 | 1,255 | 1,134 | 1,059 | 734 | 406 | 213 | 153 | 148 | 184 | 300 | 490 | 735 |
| 2002 | 1,032 | 1,053 | 934 | 634 | 445 | 303 | 212 | 140 | 163 | 273 | 640 | 1,095 |
| 2003 | 1,345 | 1,436 | 1,223 | 827 | 500 | 254 | 172 | 162 | 161 | 317 | 574 | 970 |
| 2004 | 1,306 | 1,381 | 964 | 708 | 344 | 203 | 163 | 178 | 201 | 260 | 528 | 850 |
| 2005 | 1,346 | 1,308 | 1,170 | 746 | 449 | 288 | 182 | 152 | 164 | 246 | 534 | 1,207 |
| 2006 | 1,183 | 1,043 | 1,119 | 689 | 371 | 259 | 174 | 152 | 173 | 281 | 493 | 780 |
| 2007 | 1,053 | 1,365 | 1,227 | 779 | 417 | 219 | 167 | 151 | 174 | 205 | 517 | 1,122 |
| 2008 | 1,238 | 1,155 | 1,044 | 556 | 310 | 167 | 156 | 111 | 161 | 395 | 688 | 1,073 |
| 2009 | 1,440 | 1,156 | 995 | 581 | 297 | 272 | 229 | 132 | 170 | 373 | 555 | 1,013 |
| 2010 | 1,305 | 1,033 | 780 | 464 | 299 | 199 | 159 | 180 | 153 | 338 | 663 | 1,163 |
| 2011 | 1,391 | 1,219 | 971 | 594 | 317 | 241 | 160 | 186 | 150 | 267 | 560 | 899 |
| 2012 | 1,231 | 995 | 765 | 463 | 287 | 185 | 146 | 144 | 128 | 282 | 750 | 1,046 |
| 2013 | 1,146 | 1,201 | 1,024 | 757 | 389 | 226 | 136 | 155 | 184 | 208 | 507 | 1,253 |
| 2014 | 1,476 | 1,210 | 1,207 | 535 | 454 | 217 | 142 | 138 | 172 | 338 | 795 | 1,072 |
| 2015 | 1,691 | 1,665 | 1,197 | 596 | 244 | 186 | 151 | 146 | 153 | 251 | 680 | 884 |
| 2016 | 1,293 | 1,101 | 806 | 606 | 294 | 168 | 130 | 129 | 153 | 231 | 701 | 1,249 |
| 2017 | 1,235 | 999 | 1,184 | 478 | 338 | 176 | 137 | 158 | 155 | 257 | 787 | 1,428 |
| 2018 | 1,636 | 1,048 | 1,144 | 768 | 239 | 181 | 143 | 156 | 179 | 270 | 1,050 | 1,321 |
| 2019 | 1,639 | 1,338 | 1,130 | 610 | 375 | 182 | 150 | 150 | 187 | 253 | 626 | 1,396 |
| 2020 | 1,371 | 1,281 | 932 | 694 | 351 | 168 | 172 | 149 | 197 | 238 | 521 | 1,331 |
| 2021 | 1,495 | 1,331 | 1,030 | 592 | 320 | 151 | 156 | 167 | 172 | 322 | 502 | 1,199 |
| 2022 | 1,638 | 1,284 | 985 | 607 | 246 | 160 | 158 | 164 | 192 | 246 | 466 | 1,280 |
| 2023 | 1,166 | 1,182 | 988 | 507 | 272 | 172 | 158 | 131 | 172 | 334 | 537 | 1,016 |
| 2024 | 1,401 | |||||||||||
| - = No Data Reported; -- = Not Applicable; NA = Not Available; W = Withheld to avoid disclosure of individual company data. |
| Release Date: 3/29/2024 |
| Next Release Date: 4/30/2024 |