|
Download Data (XLS File) |
|
||||||||
|
||||||||
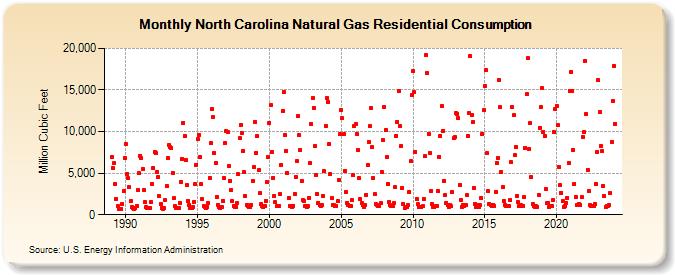
| North Carolina Natural Gas Residential Consumption (Million Cubic Feet) | ||||||||
| Year | Jan | Feb | Mar | Apr | May | Jun | Jul | Aug | Sep | Oct | Nov | Dec |
|---|---|---|---|---|---|---|---|---|---|---|---|---|
| 1989 | 6,946 | 5,655 | 6,202 | 3,723 | 1,899 | 1,020 | 744 | 695 | 745 | 1,338 | 2,823 | 6,866 |
| 1990 | 8,535 | 4,909 | 4,402 | 3,296 | 1,604 | 957 | 763 | 732 | 752 | 1,070 | 2,985 | 4,998 |
| 1991 | 7,073 | 6,819 | 5,529 | 2,963 | 1,490 | 931 | 748 | 756 | 782 | 1,486 | 3,751 | 5,647 |
| 1992 | 7,573 | 7,366 | 5,194 | 4,509 | 2,222 | 1,301 | 837 | 734 | 806 | 1,781 | 3,446 | 6,819 |
| 1993 | 8,379 | 8,140 | 8,024 | 5,030 | 1,977 | 1,039 | 829 | 761 | 815 | 1,459 | 3,918 | 6,733 |
| 1994 | 11,081 | 9,487 | 6,623 | 3,521 | 1,704 | 1,206 | 866 | 806 | 903 | 1,568 | 3,655 | 6,030 |
| 1995 | 9,068 | 9,632 | 6,916 | 3,644 | 1,882 | 1,095 | 976 | 799 | 938 | 1,402 | 4,445 | 8,581 |
| 1996 | 12,737 | 11,718 | 7,391 | 6,189 | 2,131 | 1,210 | 889 | 862 | 913 | 1,701 | 4,461 | 8,607 |
| 1997 | 10,031 | 9,983 | 5,800 | 4,080 | 2,986 | 1,596 | 1,072 | 898 | 934 | 1,438 | 4,875 | 9,202 |
| 1998 | 10,796 | 9,836 | 7,633 | 5,083 | 2,272 | 1,207 | 1,058 | 914 | 973 | 1,217 | 4,062 | 5,735 |
| 1999 | 11,181 | 7,462 | 9,427 | 5,325 | 2,597 | 1,312 | 1,062 | 921 | 1,034 | 1,679 | 3,942 | 6,912 |
| 2000 | 11,018 | 13,160 | 7,550 | 4,451 | 2,225 | 1,483 | 1,007 | 1,010 | 1,052 | 2,450 | 5,969 | 12,523 |
| 2001 | 14,705 | 9,561 | 7,702 | 5,039 | 2,040 | 1,101 | 1,086 | 948 | 1,086 | 2,514 | 4,592 | 6,443 |
| 2002 | 11,858 | 9,526 | 7,835 | 4,091 | 1,763 | 1,705 | 1,014 | 885 | 1,040 | 2,051 | 6,245 | 10,891 |
| 2003 | 14,064 | 12,890 | 8,230 | 4,754 | 2,524 | 1,454 | 1,137 | 1,004 | 1,154 | 2,290 | 5,223 | 10,686 |
| 2004 | 14,020 | 13,510 | 8,531 | 4,921 | 1,953 | 1,228 | 1,115 | 1,047 | 1,003 | 1,600 | 4,216 | 9,656 |
| 2005 | 12,601 | 11,599 | 9,662 | 5,311 | 2,771 | 1,450 | 1,203 | 1,024 | 1,087 | 1,724 | 4,739 | 10,695 |
| 2006 | 10,928 | 9,647 | 7,791 | 4,414 | 1,879 | 1,418 | 1,175 | 980 | 1,153 | 2,399 | 5,954 | 8,768 |
| 2007 | 10,618 | 12,847 | 8,108 | 4,405 | 2,440 | 1,310 | 1,154 | 993 | 1,053 | 1,356 | 5,134 | 8,947 |
| 2008 | 12,948 | 10,202 | 6,938 | 3,707 | 1,521 | 1,121 | 1,058 | 1,022 | 1,388 | 3,296 | 9,524 | 11,186 |
| 2009 | 14,881 | 10,616 | 8,259 | 3,243 | 1,315 | 754 | 962 | 947 | 1,128 | 2,760 | 6,420 | 14,358 |
| 2010 | 17,239 | 14,708 | 7,595 | 1,937 | 1,252 | 942 | 883 | 904 | 1,011 | 1,873 | 7,010 | 19,166 |
| 2011 | 17,009 | 9,734 | 7,399 | 2,890 | 1,348 | 962 | 889 | 1,066 | 1,048 | 2,812 | 6,982 | 9,506 |
| 2012 | 13,091 | 10,105 | 4,113 | 2,349 | 1,452 | 1,135 | 901 | 1,135 | 1,015 | 2,706 | 9,189 | 9,321 |
| 2013 | 12,218 | 12,114 | 11,612 | 3,617 | 1,823 | 942 | 1,119 | 1,011 | 1,145 | 2,345 | 9,514 | 12,192 |
| 2014 | 19,026 | 11,969 | 11,130 | 3,272 | 1,320 | 934 | 1,120 | 973 | 1,133 | 2,037 | 9,724 | 12,540 |
| 2015 | 15,464 | 17,363 | 7,387 | 2,814 | 1,308 | 1,123 | 1,016 | 1,214 | 1,092 | 2,737 | 6,169 | 6,836 |
| 2016 | 16,193 | 12,917 | 5,133 | 3,302 | 1,657 | 1,222 | 1,047 | 1,045 | 1,088 | 1,719 | 6,306 | 12,920 |
| 2017 | 11,943 | 7,129 | 8,165 | 2,309 | 1,514 | 1,039 | 1,135 | 994 | 1,096 | 2,110 | 8,039 | 14,460 |
| 2018 | 18,821 | 7,889 | 10,994 | 4,514 | 1,307 | 1,015 | 923 | 1,005 | 977 | 2,409 | 10,479 | 12,929 |
| 2019 | 15,211 | 9,943 | 9,502 | 3,081 | 1,363 | 1,439 | 975 | 1,015 | 1,021 | 1,766 | 9,945 | 12,688 |
| 2020 | 13,080 | 10,739 | 5,791 | 3,524 | 2,662 | 1,619 | 910 | 1,107 | 1,427 | 2,069 | 6,222 | 14,893 |
| 2021 | 17,183 | 14,929 | 7,777 | 3,730 | 2,188 | 1,127 | 1,148 | 1,331 | 1,170 | 2,113 | 9,394 | 9,976 |
| 2022 | 18,470 | 12,102 | 5,393 | 2,898 | 1,194 | 1,080 | 1,008 | 1,103 | 1,299 | 3,702 | 7,537 | 16,198 |
| 2023 | 12,315 | 8,243 | 7,621 | 3,466 | 2,237 | 894 | 1,069 | 1,091 | 1,138 | 2,630 | 8,791 | 13,672 |
| 2024 | 17,938 | |||||||||||
| - = No Data Reported; -- = Not Applicable; NA = Not Available; W = Withheld to avoid disclosure of individual company data. |
| Release Date: 3/29/2024 |
| Next Release Date: 4/30/2024 |