|
Download Data (XLS File) |
|
||||||||
|
||||||||
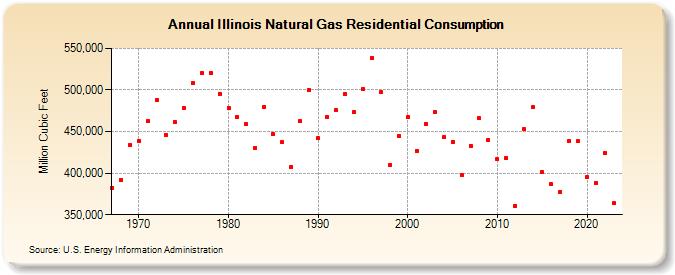
| Illinois Natural Gas Residential Consumption (Million Cubic Feet) | ||||||||
| Decade | Year-0 | Year-1 | Year-2 | Year-3 | Year-4 | Year-5 | Year-6 | Year-7 | Year-8 | Year-9 |
|---|---|---|---|---|---|---|---|---|---|---|
| 1960's | 382,277 | 392,325 | 434,065 | |||||||
| 1970's | 439,152 | 462,644 | 487,845 | 445,723 | 461,746 | 478,602 | 507,935 | 519,973 | 520,525 | 495,570 |
| 1980's | 478,489 | 467,398 | 458,572 | 430,606 | 479,572 | 446,567 | 437,081 | 407,875 | 462,339 | 499,984 |
| 1990's | 442,163 | 466,970 | 475,360 | 495,311 | 473,788 | 500,796 | 538,749 | 497,230 | 409,812 | 445,217 |
| 2000's | 467,052 | 427,146 | 459,400 | 473,451 | 443,410 | 437,572 | 398,231 | 433,048 | 465,927 | 440,065 |
| 2010's | 416,570 | 418,143 | 360,891 | 452,602 | 479,465 | 400,876 | 386,590 | 377,511 | 438,218 | 438,124 |
| 2020's | 395,633 | 388,195 | 424,291 | 363,521 |
| - = No Data Reported; -- = Not Applicable; NA = Not Available; W = Withheld to avoid disclosure of individual company data. |
| Release Date: 3/29/2024 |
| Next Release Date: 4/30/2024 |