|
Download Data (XLS File) |
|
||||||||
|
||||||||
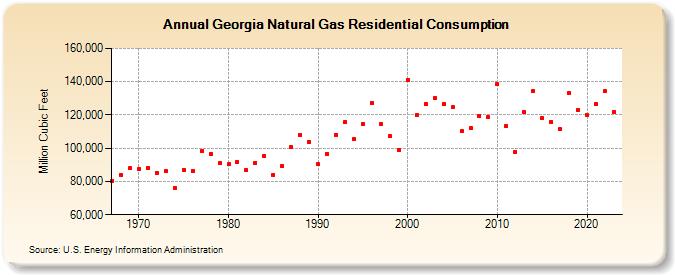
| Georgia Natural Gas Residential Consumption (Million Cubic Feet) | ||||||||
| Decade | Year-0 | Year-1 | Year-2 | Year-3 | Year-4 | Year-5 | Year-6 | Year-7 | Year-8 | Year-9 |
|---|---|---|---|---|---|---|---|---|---|---|
| 1960's | 80,322 | 84,072 | 87,878 | |||||||
| 1970's | 87,359 | 88,319 | 85,256 | 86,191 | 76,207 | 87,184 | 86,356 | 98,334 | 96,368 | 91,036 |
| 1980's | 90,240 | 91,934 | 86,822 | 91,376 | 95,299 | 84,033 | 89,171 | 100,630 | 108,125 | 103,681 |
| 1990's | 90,263 | 96,662 | 108,214 | 115,655 | 105,436 | 114,670 | 127,062 | 114,383 | 107,398 | 98,777 |
| 2000's | 140,838 | 119,969 | 126,667 | 129,907 | 126,492 | 124,560 | 110,245 | 111,895 | 119,375 | 118,589 |
| 2010's | 138,671 | 113,335 | 97,664 | 121,629 | 134,482 | 118,028 | 115,922 | 111,249 | 133,085 | 123,169 |
| 2020's | 119,792 | 126,670 | 134,256 | 122,024 |
| - = No Data Reported; -- = Not Applicable; NA = Not Available; W = Withheld to avoid disclosure of individual company data. |
| Release Date: 3/29/2024 |
| Next Release Date: 4/30/2024 |