|
Download Data (XLS File) |
|
||||||||
|
||||||||
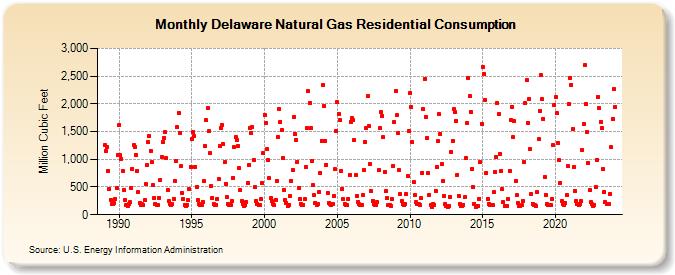
| Delaware Natural Gas Residential Consumption (Million Cubic Feet) | ||||||||
| Year | Jan | Feb | Mar | Apr | May | Jun | Jul | Aug | Sep | Oct | Nov | Dec |
|---|---|---|---|---|---|---|---|---|---|---|---|---|
| 1989 | 1,257 | 1,153 | 1,223 | 793 | 466 | 272 | 192 | 189 | 207 | 275 | 485 | 1,085 |
| 1990 | 1,613 | 1,069 | 1,008 | 797 | 449 | 260 | 183 | 166 | 190 | 222 | 483 | 830 |
| 1991 | 1,249 | 1,217 | 1,079 | 795 | 409 | 211 | 169 | 186 | 175 | 261 | 547 | 892 |
| 1992 | 1,303 | 1,417 | 1,158 | 948 | 528 | 301 | 197 | 179 | 183 | 307 | 628 | 1,044 |
| 1993 | 1,304 | 1,386 | 1,487 | 1,019 | 448 | 243 | 185 | 167 | 185 | 289 | 609 | 974 |
| 1994 | 1,579 | 1,836 | 1,480 | 879 | 397 | 281 | 179 | 159 | 180 | 259 | 459 | 869 |
| 1995 | 1,359 | 1,487 | 1,417 | 865 | 501 | 264 | 197 | 177 | 176 | 230 | 601 | 1,231 |
| 1996 | 1,701 | 1,918 | 1,504 | 1,116 | 516 | 310 | 196 | 175 | 181 | 291 | 648 | 1,236 |
| 1997 | 1,558 | 1,621 | 1,272 | 948 | 560 | 320 | 195 | 179 | 184 | 252 | 671 | 1,213 |
| 1998 | 1,398 | 1,351 | 1,240 | 840 | 446 | 250 | 196 | 164 | 176 | 231 | 571 | 895 |
| 1999 | 1,562 | 1,472 | 1,577 | 991 | 498 | 254 | 202 | 168 | 169 | 278 | 576 | 1,116 |
| 2000 | 1,800 | 1,662 | 1,178 | 985 | 655 | 294 | 246 | 188 | 172 | 270 | 615 | 1,404 |
| 2001 | 1,902 | 1,678 | 1,531 | 1,026 | 451 | 269 | 212 | 161 | 183 | 334 | 615 | 815 |
| 2002 | 1,766 | 1,455 | 1,352 | 955 | 483 | 279 | 201 | 171 | 180 | 275 | 865 | 1,568 |
| 2003 | 2,231 | 2,018 | 1,566 | 966 | 535 | 350 | 217 | 181 | 194 | 412 | 759 | 1,338 |
| 2004 | 2,339 | 1,962 | 1,330 | 905 | 398 | 219 | 193 | 180 | 199 | 345 | 818 | 1,509 |
| 2005 | 2,031 | 1,824 | 1,705 | 790 | 468 | 276 | 197 | 181 | 182 | 285 | 721 | 1,679 |
| 2006 | 1,743 | 1,700 | 1,346 | 710 | 343 | 232 | 192 | 176 | 182 | 363 | 808 | 1,317 |
| 2007 | 1,561 | 2,133 | 1,594 | 916 | 421 | 256 | 188 | 168 | 183 | 221 | 798 | 1,559 |
| 2008 | 1,849 | 1,782 | 1,393 | 770 | 423 | 306 | 176 | 176 | 165 | 278 | 882 | 1,675 |
| 2009 | 2,236 | 1,792 | 1,466 | 806 | 370 | 242 | 190 | 175 | 186 | 370 | 702 | 1,513 |
| 2010 | 2,197 | 1,942 | 1,309 | 585 | 348 | 228 | 195 | 192 | 180 | 296 | 755 | 1,899 |
| 2011 | 2,456 | 1,763 | 1,383 | 747 | 359 | 177 | 148 | 200 | 176 | 435 | 861 | 1,323 |
| 2012 | 1,808 | 1,461 | 912 | 604 | 332 | 195 | 155 | 141 | 161 | 326 | 1,132 | 1,337 |
| 2013 | 1,901 | 1,856 | 1,688 | 723 | 343 | 200 | 152 | 160 | 183 | 313 | 1,016 | 1,663 |
| 2014 | 2,463 | 2,138 | 1,858 | 825 | 496 | 196 | 137 | 161 | 158 | 292 | 949 | 1,644 |
| 2015 | 2,665 | 2,533 | 2,076 | 754 | 289 | 194 | 175 | 178 | 168 | 406 | 772 | 1,049 |
| 2016 | 2,009 | 1,812 | 1,094 | 794 | 458 | 224 | 164 | 155 | 165 | 281 | 794 | 1,711 |
| 2017 | 1,951 | 1,397 | 1,689 | 612 | 350 | 207 | 151 | 158 | 172 | 249 | 953 | 2,007 |
| 2018 | 2,421 | 1,655 | 2,092 | 1,178 | 372 | 200 | 179 | 179 | 157 | 402 | 1,362 | 1,879 |
| 2019 | 2,515 | 2,084 | 1,730 | 689 | 363 | 192 | 184 | 168 | 178 | 288 | 1,266 | 1,986 |
| 2020 | 2,118 | 1,830 | 1,300 | 980 | 576 | 247 | 196 | 172 | 209 | 351 | 877 | 1,995 |
| 2021 | 2,474 | 2,345 | 1,548 | 859 | 435 | 249 | 188 | 181 | 202 | 241 | 1,168 | 1,634 |
| 2022 | 2,697 | 1,989 | 1,489 | 941 | 453 | 224 | 185 | 166 | 184 | 492 | 990 | 2,130 |
| 2023 | 1,919 | 1,673 | 1,564 | 821 | 410 | 225 | 186 | 186 | 191 | 381 | 1,213 | 1,725 |
| 2024 | 2,267 | |||||||||||
| - = No Data Reported; -- = Not Applicable; NA = Not Available; W = Withheld to avoid disclosure of individual company data. |
| Release Date: 3/29/2024 |
| Next Release Date: 4/30/2024 |