|
Download Data (XLS File) |
|
||||||||
|
||||||||
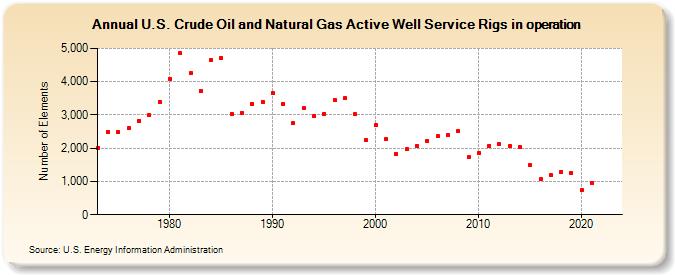
| U.S. Crude Oil and Natural Gas Active Well Service Rigs in operation (Number of Elements) | ||||||||
| Decade | Year-0 | Year-1 | Year-2 | Year-3 | Year-4 | Year-5 | Year-6 | Year-7 | Year-8 | Year-9 |
|---|---|---|---|---|---|---|---|---|---|---|
| 1970's | 2,008 | 2,490 | 2,486 | 2,601 | 2,828 | 2,989 | 3,399 | |||
| 1980's | 4,089 | 4,849 | 4,249 | 3,733 | 4,659 | 4,716 | 3,037 | 3,059 | 3,339 | 3,391 |
| 1990's | 3,658 | 3,331 | 2,757 | 3,193 | 2,961 | 3,041 | 3,445 | 3,499 | 3,014 | 2,232 |
| 2000's | 2,692 | 2,267 | 1,830 | 1,967 | 2,064 | 2,222 | 2,364 | 2,388 | 2,515 | 1,722 |
| 2010's | 1,854 | 2,075 | 2,113 | 2,064 | 2,024 | 1,481 | 1,061 | 1,187 | 1,292 | 1,253 |
| 2020's | 738 | 949 | NA | NA |
| - = No Data Reported; -- = Not Applicable; NA = Not Available; W = Withheld to avoid disclosure of individual company data. |
| Release Date: 3/29/2024 |
| Next Release Date: 4/30/2024 |
Referring Pages: