A Look at the U.S. Commercial Building Stock: Results from EIA's 2012 Commercial Buildings Energy Consumption Survey (CBECS)
CBECS 2012 - Release date: March 4, 2015
What is a commercial building?
The CBECS includes buildings greater than 1,000 square feet that devote more than half of their floorspace to activity that is not residential, manufacturing, industrial, or agricultural.
The 2012 CBECS collected building characteristics data from more than 6,700 U.S. commercial buildings. This report highlights findings from the survey, with details presented in the Building Characteristics tables.
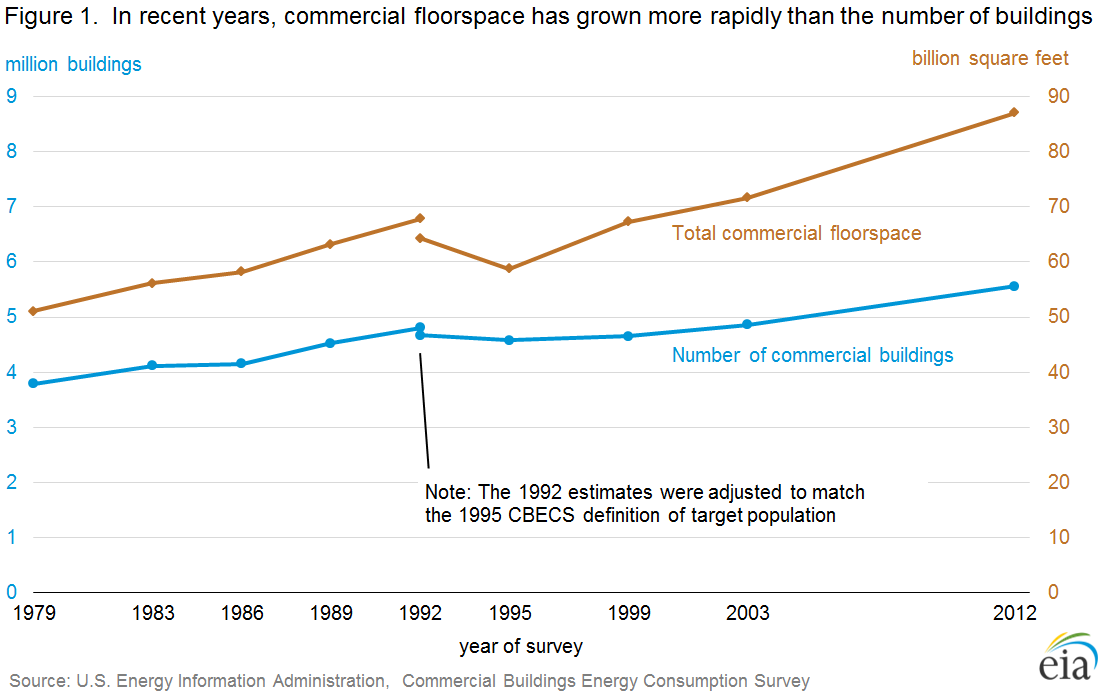
Building size has outpaced the growth in the number of buildings over the past decade, according to the Commercial Buildings Energy Consumption Survey (CBECS). CBECS estimates that there were 5.6 million commercial buildings in the United States in 2012, comprising 87 billion square feet of floorspace. This level represents a 14% increase in the number of buildings and a 21% increase in floorspace since 2003, the last year for which CBECS results are available.
The size, vintage, geographic region, and principal activity1 of a building are among the key determinants that influence its energy use. These factors are the focus of this initial set of tables. This release is the first in a series of Detailed Tables for the 2012 CBECS, providing an in-depth look at the building stock and the attributes that drive commercial energy use. The tables provide a wealth of information about buildings, including their structure, ownership, types of energy used, HVAC and other energy-related equipment, office equipment and computers, and lighting types; these areas will be explored further in upcoming EIA reports and articles.
Why does it take until 2015 to publish commercial buildings energy data for 2012?
Commercial buildings energy data is developed in three serial stages that begin after the year for which the data are being collected.
In the Commercial Buildings Energy Consumption Survey (CBECS), EIA collects energy characteristics data about buildings and their occupants using a questionnaire administered by an interviewer. During the CBECS interview, respondents are also asked to report the buildings' energy usage for the reference year, and for that reason, data collection cannot start until the reference year is over. CBECS 2012 interviews were conducted in person or by telephone at over 6,700 buildings around the country between April and November 2013.
About half of CBECS' building respondents self-report their energy usage and costs. For buildings that cannot provide their own usage data, EIA works directly with energy providers to obtain that consumption data for them. These Energy Supplier Survey (ESS) data were collected between March and October 2014. As data processing for the ESS data comes to a close, a modeling effort to produce estimates of energy end uses begins.
With today's release, EIA is providing in-depth characteristics data. Results for consumption and end uses will be released beginning in September 2015.
EIA is pursuing strategies to update and accelerate the processes that produce its residential and commercial buildings data series. For the next Residential Energy Consumption Survey (RECS), EIA is undertaking a pilot web and mail data collection which should shorten the collection cycle. Should this new approach prove successful in acquiring high-quality data, it will also be considered for use in the CBECS.
Trends – 1979 to 2012: Growth in building size outpaces increases in building stock
Between the first CBECS (conducted in 1979) and the latest 2012 CBECS, the number of commercial buildings in the United States has increased from 3.8 million to 5.6 million, and the amount of commercial floorspace has increased from 51 billion to 87 billion square feet. A growing population has led to a need for more buildings, and the changing needs and wants of consumers has led to larger buildings.
How does EIA produce reliable results from a sample survey?
The CBECS is a nationally representative sample survey. See How Were Buildings Selected for the 2012 CBECS? for an overview of the sampling process. After the sample was selected, preparations for the interviewing phase began. In April 2013, about 250 field interviewers were trained to visit the sampled buildings across the United States and locate respondents knowledgeable about energy use in these buildings. After recruiting a respondent at a building, the field interviewer’s job was to conduct an interview on a laptop computer asking questions about the building’s structure, use, energy equipment, and energy use. Between April and November 2013, interviews were conducted in-person or by telephone at over 6,700 buildings nationwide. (See How Was the 2012 CBECS Buildings Survey Conducted? for more detail.) Because every building had a chance to be selected and that chance is known, the resultant sample weight tells us how many similar buildings each sampled case represents. The final dataset is representative of the entire U.S. commercial building population.
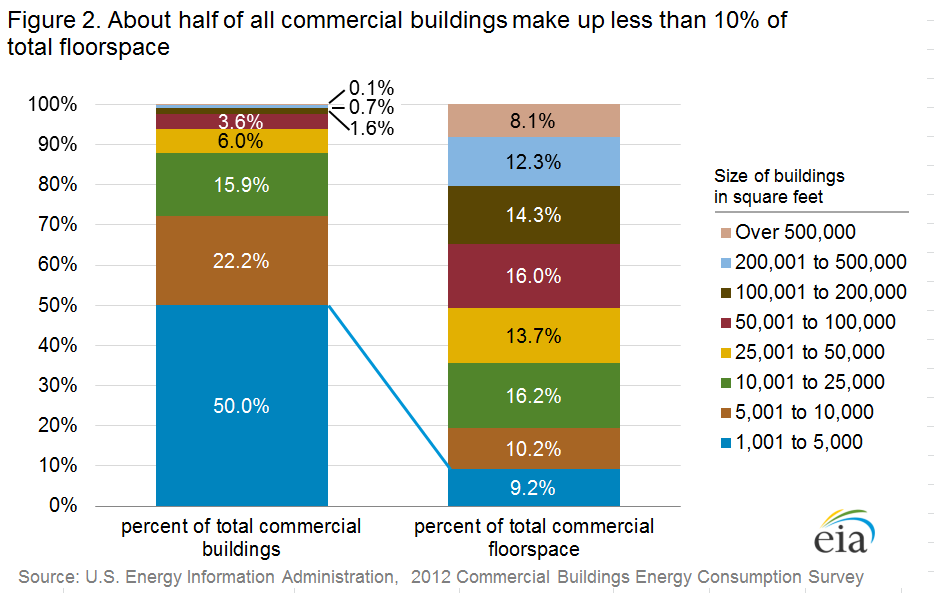
Size of buildings: Although there are relatively few very large buildings (over 100,000 square feet of floorspace), they account for more than one-third of total commercial building floorspace
Commercial buildings are often depicted showing a skyline of towering buildings. However, the vast majority of commercial buildings are relatively small. About half of buildings are 5,000 square feet in size or smaller, and nearly three-fourths are 10,000 square feet or smaller. The median building size is 5,000 square feet (i.e., half the buildings are larger than this and half are smaller), while the average size is 15,700 square feet. The average is larger than the median because of the influence of a small number of very large buildings; buildings over 100,000 square feet (from large high schools to hospitals to sprawling distribution centers to skyscrapers, for example) make up only about 2% of the building count but about 35% of the total floorspace.
Additional characteristics information by building size category can be found in Detailed Tables B6 and B7.
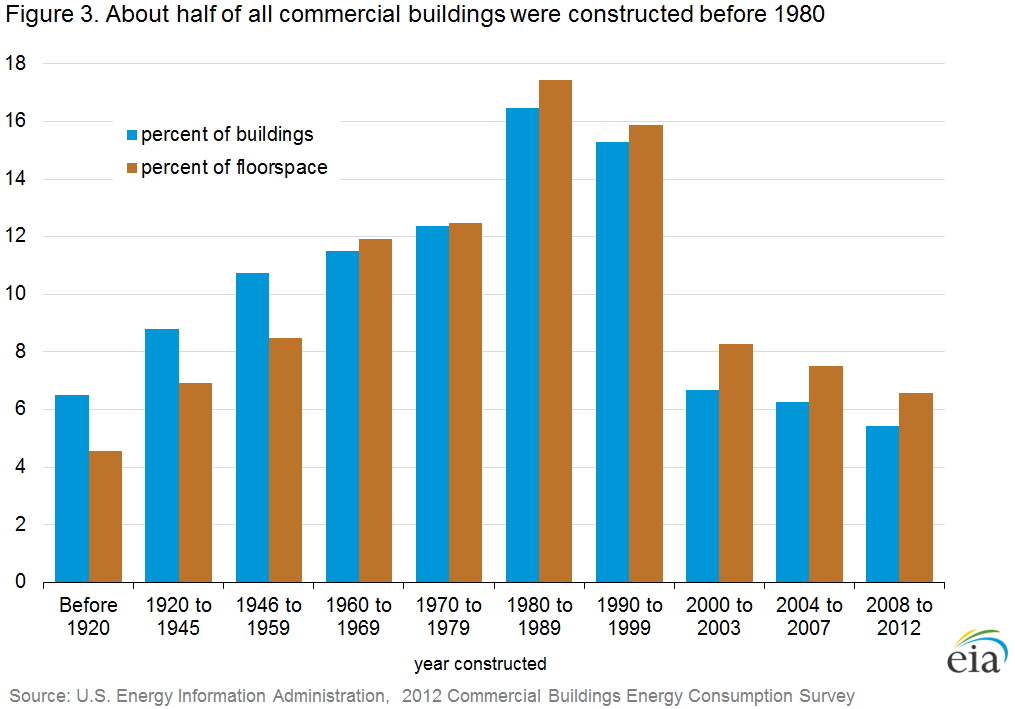
Year constructed: The commercial building stock is middle-aged, and newer buildings are larger than older ones
Commercial buildings remain in use for many decades. Although about 12% of commercial buildings (comprising 14% of commercial floorspace) were built since 2003, the commercial building stock is still fairly old, with about half of all buildings constructed before 1980; the median age of buildings in 2012 was 32 years (Detailed Table B2). However, in the existing building stock, the newest buildings outnumber the oldest; there are more buildings built in the 2000s than buildings built prior to 1946.
Newer buildings tend to be larger than older buildings. The average building size for those constructed before 1960 is 12,000 square feet; buildings constructed between 1960 and 1999 average 16,300 square feet; and buildings constructed in the 2000s average 19,000 square feet. The differences between these average building sizes are statistically significant2 .
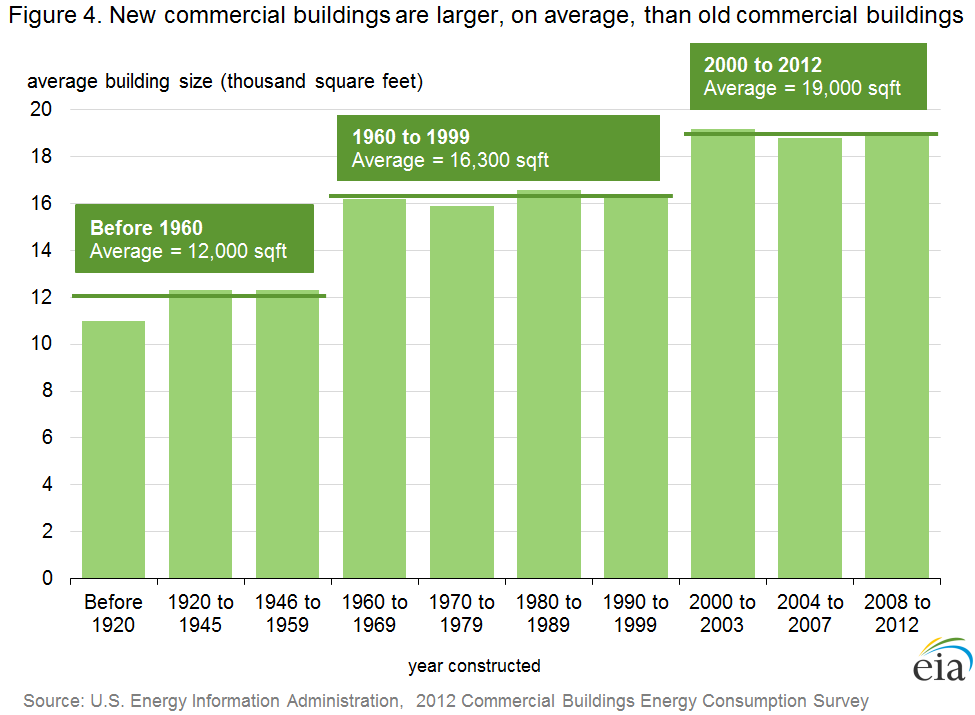
What is contributing to this increase in the size of new buildings? Function and population shift are the two apparent main drivers; a few building types have increased in average size over the years as consumers’ needs and wants have changed, and building sizes are larger in the regions that have also experienced the most growth in number of buildings, as discussed in the Census region and division section below.
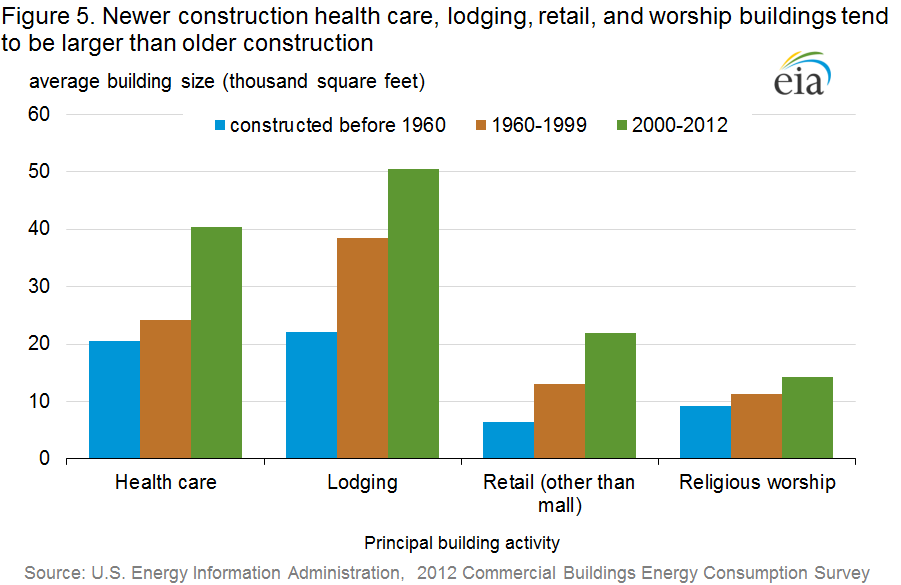
Four building types showed a statistically significant increase in building size when comparing buildings constructed before 1960 to those constructed after 1999:
- Health care buildings are getting larger, most likely to meet the needs of a population whose average life expectancy continues to increase.
- The size of lodging buildings increases substantially across vintages. Air travel became more affordable and accessible after 1978 when the industry was deregulated, and it follows that the growing numbers of both leisure and business travelers led to the construction of larger hotels.
- Retail (other than shopping mall) buildings–a subset of the mercantile category, which includes malls–have become larger, likely a result of the trend towards big box stores.
- Religious worship buildings are also larger, possibly an effect of megachurches, which have seen a rise in popularity in the United States in the past two decades.
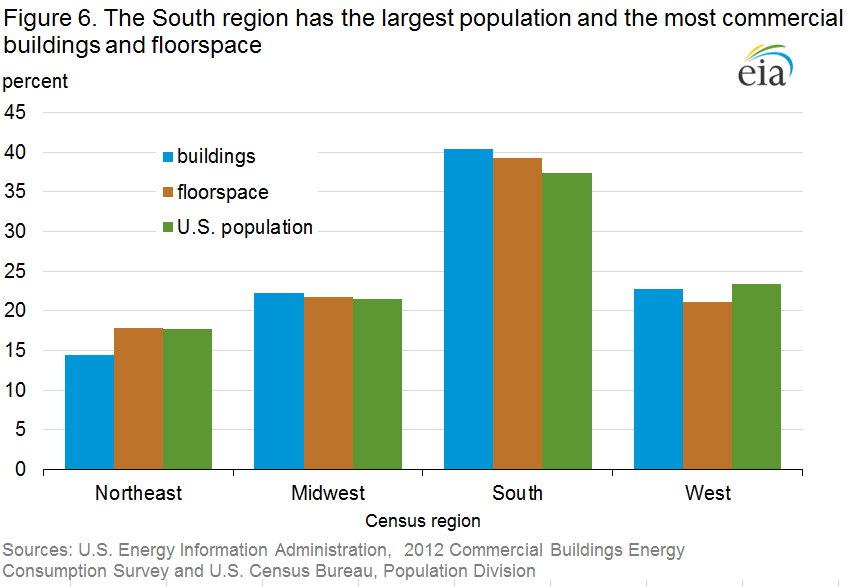
Census region and division (see map): The South has the most commercial buildings, but the Northeast has the largest commercial buildings
The South Census region, the most populous of the four Census regions, has the largest pe rcentage of commercial buildings and commercial floorspace, with about 40% of both total buildings and floorspace. The Midwest and West regions each account for more than one-fifth of commercial buildings and floorspace. The Northeast has the fewest number of buildings, about one-third the number in the South.
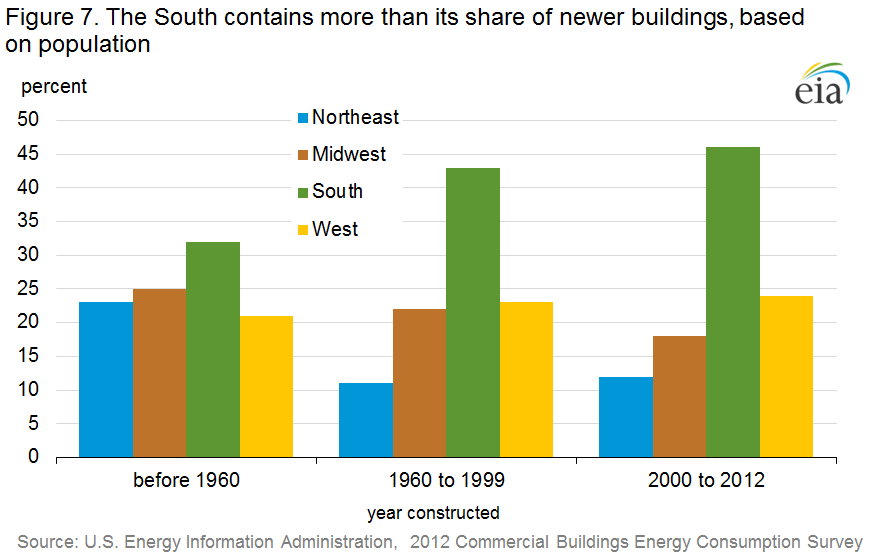
However, when comparing the regional breakout by building vintage or year constructed, the patterns vary. Older vintages are more evenly distributed across the regions, whereas in the newer buildings, the South contains a slightly disproportionate share compared to the population (the South comprises 37% of the population but 46% of new buildings). Almost half of all commercial buildings constructed since the year 2000 were built in the South.
The large share of new buildings constructed in the South, coupled with the fact that average building sizes are increasing there (and in the Midwest and West), helps to explain the increase in size for the vintage 2000-2012 buildings. In Figure 8, the change in size between the oldest and the newest building categories is statistically significant in all regions except for the Northeast, where the difference is not statistically significant.
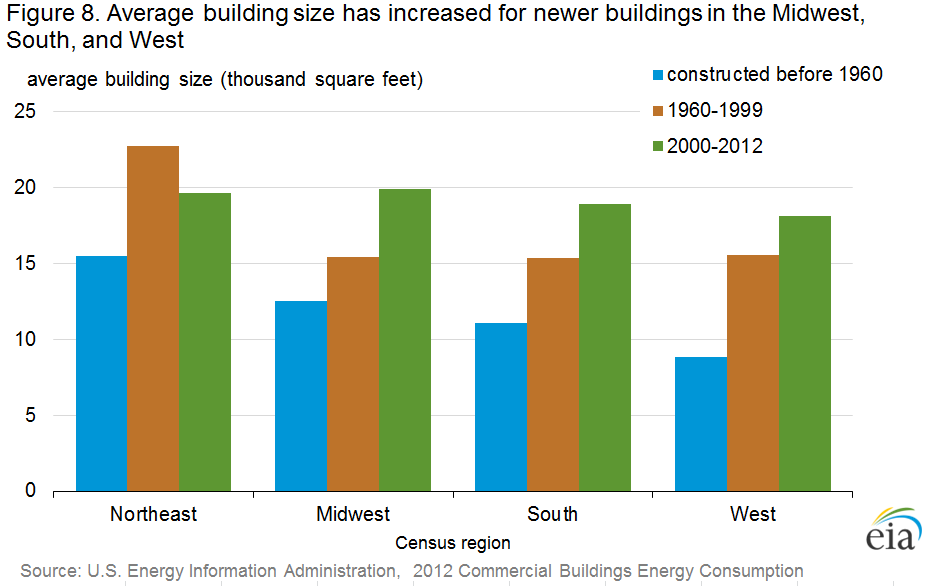
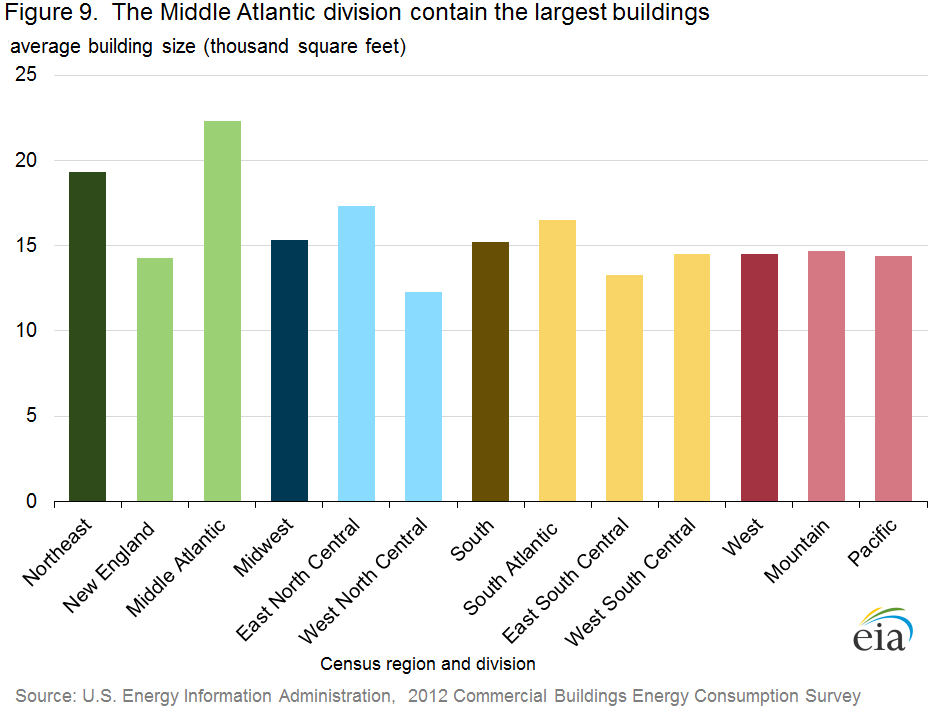
Commercial buildings in the Northeast region are the largest buildings overall. Cities in the Northeast are well established and have had very large buildings in place for many years; the median age for buildings in the Northeast is 46 years, in contrast to 29 years for those in South. In the Northeast, buildings are, on average, 4,000 to 5,000 square feet larger than buildings in the other regions. The Northeast region includes the Middle Atlantic division (New York, Pennsylvania, and New Jersey), where buildings average 22,300 square feet. The Middle Atlantic contains only 9% of all commercial buildings but 19% of the total office floorspace and 19% of all the total health care floorspace. (Detailed Tables B4 and B5).
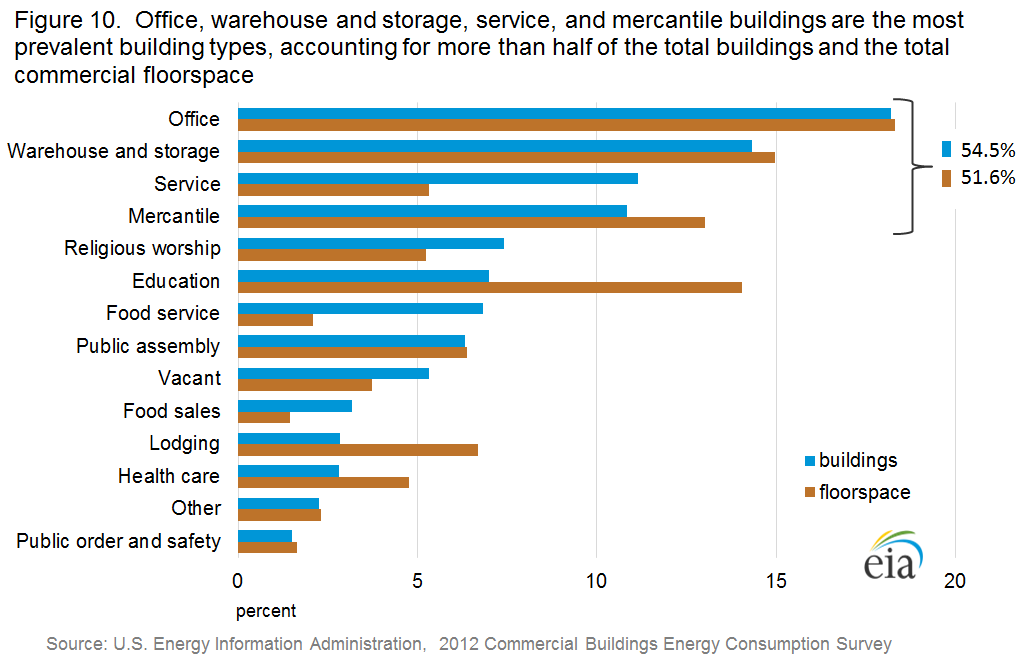
Principal building activities: The most prevalent building types account for the majority of the total buildings and floorspace, while the building types with the largest average buildings are less common in the building stock
The commercial building sector is extremely diverse. The 2012 survey identified more than 100 subcategories of building activity, which are aggregated into the 14 principal building activities shown in the Detailed Tables and in the figures below. CBECS includes buildings as small and singular in activity as a freestanding bank or fast food restaurant, to buildings as large and complex as an office building with hundreds of tenants or a major airport terminal. CBECS also includes vacant buildings; some vacant buildings use energy, either for maintenance purposes or because a small amount of space is still used in the building.
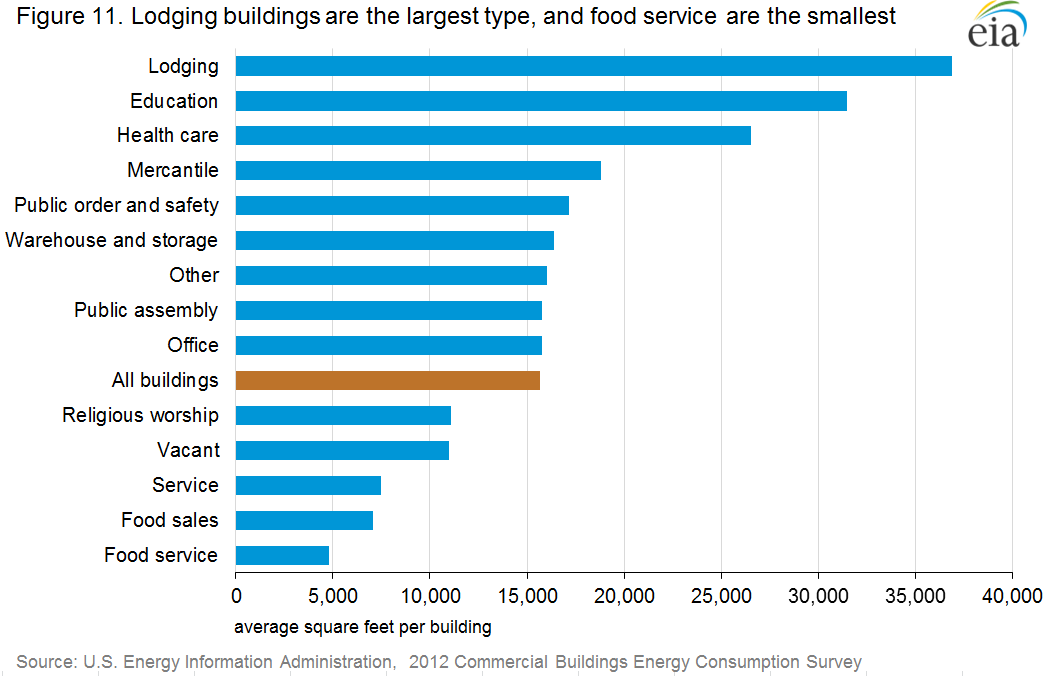
Among the general building activities, lodging, education, and health care are the largest buildings, on average. The health care category's average is greatly affected by the size of inpatient health care buildings (i.e., hospitals), which have an average size of 247,800 square feet per building, compared to outpatient health care buildings, which have an average size of 12,100 square feet.
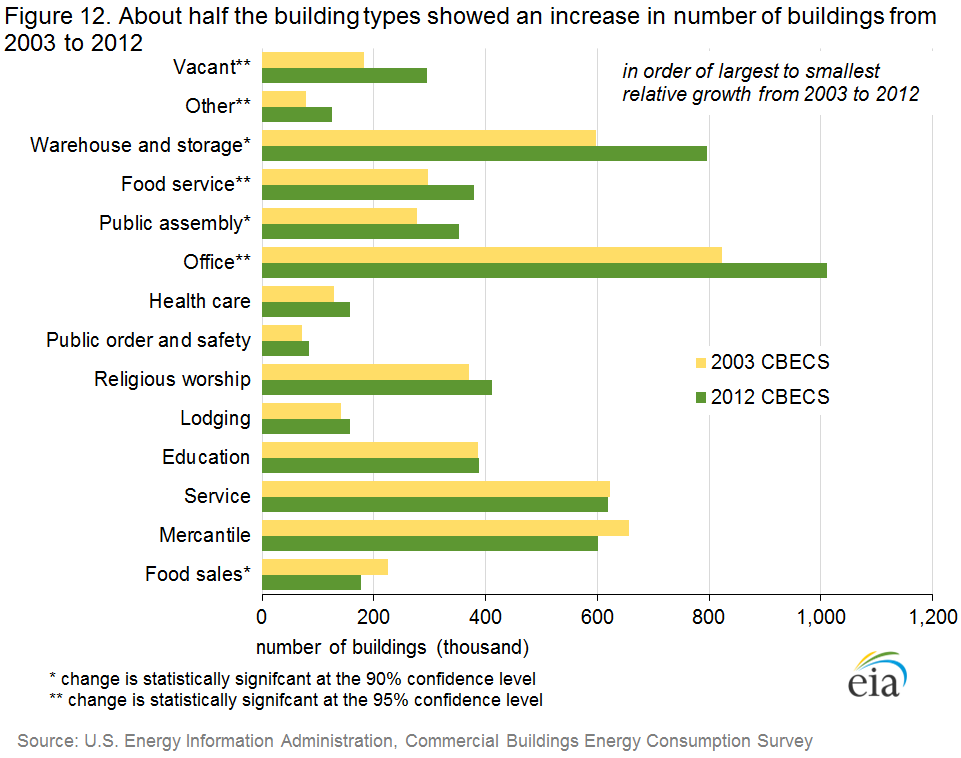
Since 2003, about half of the principal building activities have increased their numbers in the building stock. The greatest growth was in vacant buildings and other types of buildings, which include buildings such as airplane hangars, laboratories, and data centers. Warehouses, food service buildings, public assembly buildings, and office buildings also increased between 2003 and 2012, while food sales buildings (e.g., grocery and convenience stores) showed a decrease. Mercantile buildings (retail and malls) also showed a decrease3 , although it is not statistically significant.
Additional characteristics information by building type can be found in DetailedTables B11 through B14.
Footnote
1 CBECS principal building activity is defined as the activity occupying the most floorspace. Respondents are first asked if there is one activity that occupies 75% or more of the floorspace. If not, CBECS collects the top three building activities and their corresponding percents, and the principal activity is assigned as the one comprising the most floorspace.
2Except where otherwise noted, differences mentioned are statistically significant at the 95% confidence level. Because CBECS is a sample survey, each estimate has sampling error associated with it, which should be considered when comparing estimates. See What is a Relative Standard Error (RSE)? and Estimation of Standard Errors for more information.
3 Estimates for number of food sales buildings can be somewhat misleading because grocery stores and convenience stores are often part of strip shopping centers and therefore included in the Enclosed and strip malls category in CBECS. Enclosed and strip malls is a subcategory of Mercantile and is displayed in the Detailed Tables. See How Was the 2012 CBECS Buildings Survey Conducted? for more detail about data collection in strip shopping centers.
Specific questions on this product may be directed to Joelle Michaels.


