Effect of Increased Levels of Liquefied Natural Gas Exports on U.S. Energy Markets
Release date: October 29, 2014
Introduction
This report responds to a May 29, 2014 request from the U.S. Department of Energy's Office of Fossil Energy (DOE/FE) for an update of the Energy Information Administration's (EIA) January 2012 study of liquefied natural gas (LNG) export scenarios. This updated study, like the prior one, is intended to serve as an input to be considered in the evaluation of applications to export LNG from the United States under Section 3 of the Natural Gas Act, which requires DOE to grant a permit to export domestically produced natural gas unless it finds that such action is not consistent with the public interest. Appendix A provides a copy of the DOE/FE request letter.
DOE/FE asked EIA to assess how specified scenarios of increased exports of LNG from the Lower 48 states could affect domestic energy markets, focusing on consumption, production, and prices. The DOE/FE scenarios posit total LNG exports sourced from the Lower 48 states of 12 billion standard cubic feet per day (Bcf/d), 16 Bcf/d, and 20 Bcf/d, with these exports phased in at a rate of 2 Bcf/d each year beginning in 2015.
DOE/FE requested that EIA consider the specified Lower 48 states LNG export scenarios in the context of baseline cases from EIA's 2014 Annual Energy Outlook (AEO2014) that reflect varying perspectives on the domestic natural gas supply situation, the growth rate of the U.S. economy, and natural gas use for electricity generation. The AEO2014 cases considered in this report include:
- The AEO2014 Reference case
- The High Oil and Gas Resource (HOGR) case, which reflects more optimistic assumptions about domestic natural gas supply prospects than the Reference case
- The Low Oil and Gas Resource (LOGR) case, which reflects less optimistic assumptions about domestic oil and natural gas supply prospects than the Reference case
- The High Economic Growth (HEG) case, in which the U.S. gross domestic product grows at an average annual rate 0.4 percentage points higher than in the Reference case, resulting in higher domestic energy demand
- The Accelerated Coal and Nuclear Retirements (ACNR) case, in which higher costs for running existing coal and nuclear plants result in accelerated capacity retirements, resulting in more reliance on natural gas to fuel electricity generation than in the Reference case
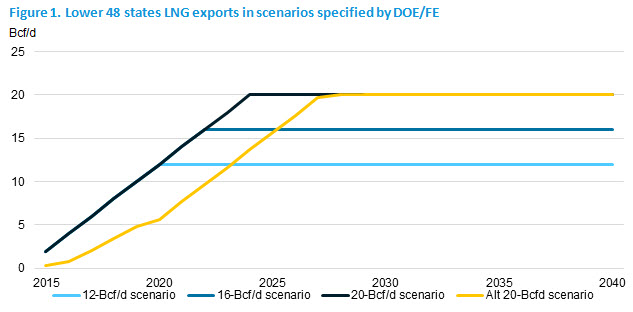
EIA recognizes that the ramp-up specified by DOE/FE for the scenarios analyzed in this report, under which total Lower 48 states LNG exports reach 12 Bcf/d in 2020, is extremely aggressive, indeed almost impossible, and that the ultimate LNG export levels specified by DOE/FE are also very unlikely for some of the baselines. EIA understood that the DOE/FE scenarios were intended to provide results that show an outer envelope of domestic production and consumption responses that might follow from the approval of export licenses beyond 12 Bcf/d. Accordingly, EIA also included a 20 Bcf/d export scenario, applied to the Reference case, with a delayed ramp-up to identify the impact of higher LNG exports implemented at a more credible pace. The DOE/FE scenarios, as well as the alternative 20 Bcf/d (Alt 20-Bcfd) scenario are shown in Figure 1.
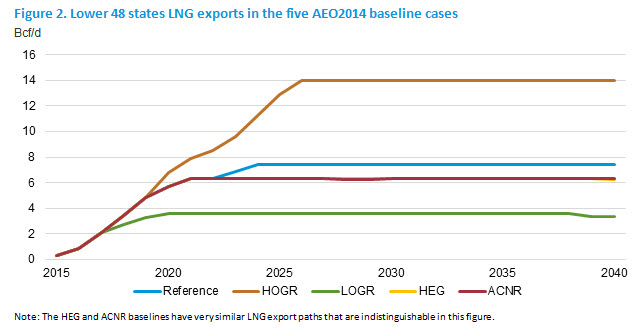
Each of the five AEO2014 cases used as baselines in this study already includes some amount of LNG exports from the Lower 48 states. The LNG exports in the AEO2014 baseline cases, rather than the scenarios specified for this study, reflect EIA’s own views on future LNG exports. As shown in Figure 2, LNG exports from the Lower 48 states in the baselines have projected 2040 levels ranging from 3.3 Bcf/d (LOGR case) to 14.0 Bcf/d (HOGR case). Projected exports are positively correlated with the abundance of the domestic resource base, and negatively correlated with the level of domestic natural gas demand.1
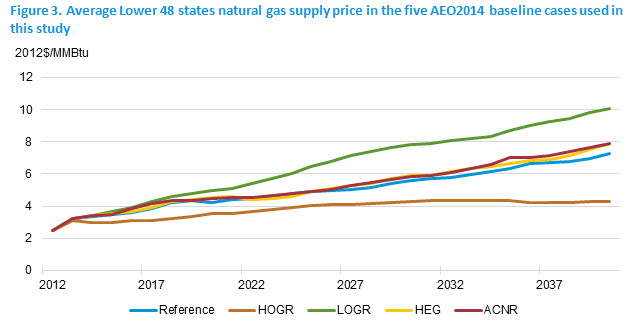
As shown in Figure 3, projected U.S. natural gas prices increase in each of the five baseline cases. The price paths depend on the assumptions made regarding the resource base and advances in production technology, economic growth, and natural gas demand. In the Reference case, the average Lower 48 state supply price more than doubles between 2013 and 2040, ultimately reaching $7.25/Million British thermal units (MMBtu) in 2040.2 In contrast, under the more optimistic resource assumptions of the HOGR case, prices increase by only 38% by 2040 and never rise above $4.34/MMBtu. Under the more pessimistic resource assumptions of the LOGR case, prices reach $10.08/MMBtu in 2040.
The different price paths in Figure 3 are key drivers of variation in the level of Lower 48 states LNG exports across the AEO2014 baseline cases. The amount of added Lower 48 LNG exports above the baseline projection required to fulfill each of the export scenarios specified by DOE/FE for this analysis, cumulative Lower 48 LNG exports at specified dates for each baseline, and additional Lower 48 states cumulative exports above baseline through those same specified dates for each of the DOE/FE scenarios are reported in Table 1. For example in the Reference case baseline, Lower 48 states exports are 5.7 Bcf/d in 2020 and cumulative exports through 2020 are 6.2 trillion cubic feet (Tcf). In the 12-, 16- and 20-Bcf/d export scenarios, cumulative exports through 2020 are 9.1 Tcf above those in the Reference case baseline (as shown in the lower panel of Table 1).
Estimated price and market responses to each pairing of a specified export scenario and a baseline will reflect the additional amount of LNG exports needed to reach the targeted export level starting from that baseline. For example, as shown in Table 1, the 20-Bcf/d export scenario starting from the HOGR baseline requires a smaller additional amount of cumulative exports relative to baseline (55.4 Tcf over the 2015-40 period) than the 12-Bcf/d export scenario starting from the LOGR baseline (72.3 Tcf over the same period).
| Reference | 2015 | 2020 | 2025 | 2030 | 2035 | 2040 |
|---|---|---|---|---|---|---|
| Export level (Bcf/d) | 0.3 | 5.7 | 7.4 | 7.4 | 7.4 | 7.4 |
| Cumulative exports since 2015 (Tcf) | 6.2 | 18.8 | 32.3 | 45.9 | 59.4 | |
| Difference from baseline in cumulative LNG exports for each DOE/FE export scenario/baseline paring (Tcf) | ||||||
| 12 Bcf/d | 9.1 | 18.5 | 26.8 | 35.2 | 43.5 | |
| 16 Bcf/d | 9.1 | 25.0 | 40.7 | 56.3 | 72.0 | |
| 20 Bcf/d | 9.1 | 28.7 | 51.6 | 74.6 | 97.5 | |
| Alt 20 Bcf/d* | 0.0 | 8.8 | 30.7 | 53.7 | 76.6 | |
| High Oil and Gas Resource | 2015 | 2020 | 2025 | 2030 | 2035 | 2040 |
|---|---|---|---|---|---|---|
| Export level (Bcf/d) | 0.3 | 6.8 | 12.9 | 14.0 | 14.0 | 14.0 |
| Cumulative exports since 2015 (Tcf) | 6.6 | 24.9 | 50.5 | 76.0 | 101.6 | |
| Difference from baseline in cumulative LNG exports for each DOE/FE export scenario/baseline paring (Tcf) | ||||||
| 12 Bcf/d | 8.7 | 12.3 | 8.6 | 5.0 | 1.3 | |
| 16 Bcf/d | 8.7 | 18.9 | 22.5 | 26.2 | 29.8 | |
| 20 Bcf/d | 8.7 | 22.5 | 33.5 | 44.4 | 55.4 | |
| Alt 20 Bcf/d* | ||||||
| Low Oil and Gas Resource | 2015 | 2020 | 2025 | 2030 | 2035 | 2040 |
|---|---|---|---|---|---|---|
| Export level (Bcf/d) | 0.3 | 3.6 | 3.6 | 3.6 | 3.6 | 3.3 |
| Cumulative exports since 2015 (Tcf) | 4.6 | 11.2 | 17.7 | 24.3 | 30.6 | |
| Difference from baseline in cumulative LNG exports for each DOE/FE export scenario/baseline paring (Tcf) | ||||||
| 12 Bcf/d | 10.7 | 26.1 | 41.4 | 56.8 | 72.3 | |
| 16 Bcf/d | 10.7 | 32.6 | 55.3 | 77.9 | 100.8 | |
| 20 Bcf/d | 10.7 | 36.3 | 66.2 | 96.2 | 126.3 | |
| Alt 20 Bcf/d* | ||||||
| *Note: EIA included the Alt 20 Bcf/d scenario to reflect a more realistic ramp-up of near-term LNG exports. | ||||||
Although the study reports results for all pairings of export scenarios and baselines, some combinations are inherently less plausible than others. High additional levels of LNG exports are unlikely to occur under baseline conditions associated with high U.S. natural gas prices because high domestic prices and limited resources to grow supply would discourage investment in projects to liquefy and export domestic gas. The combination of the 20-Bcf/d export scenario with LOGR case baseline, which projects U.S. producer-level prices near $8/MMBtu by 2030 and above $10/MMBtu by 2040 even before consideration of added LNG exports, seems particularly implausible.
Analysis approach
EIA used the five AEO2014 cases described above as the starting point for its analysis and made several changes to represent the export scenarios specified in the study request. EIA exogenously added LNG exports from the Lower 48 states in its model runs, using the National Energy Modeling System (NEMS), to reach the targeted LNG export levels. The Mid-Atlantic and South Atlantic regions were each assumed to host 1 Bcf/d of LNG export capacity, the Pacific region was assumed to host 2 Bcf/d, with all of the remaining Lower 48 states' export capacity hosted along the Gulf Coast in the West South Central Census division.
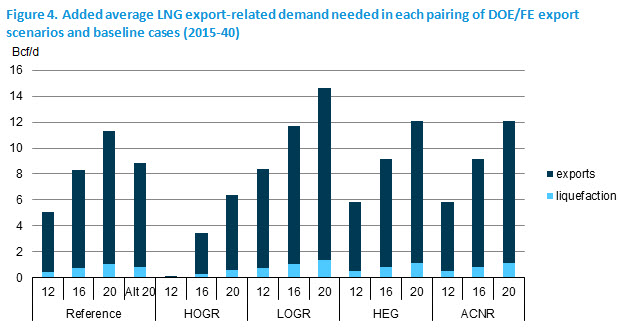
In addition to the volume of natural gas needed to satisfy the levels of LNG exports defined in the scenarios, a supplemental volume of gas is required in order to liquefy natural gas for export as LNG. EIA assumed that this volume would equal 10% of the LNG export volume (Figure 4). The additional natural gas consumed during the liquefaction process is counted as fuel use within the U.S. region where liquefaction occurs.
As in AEO2014, U.S. natural gas pipeline imports and exports and U.S. LNG imports are endogenously determined in the model. However, LNG exports out of Alaska were set exogenously to the projected level from the corresponding baseline cases.
One further modeling change was applied only in export scenario runs using the ACNR case. The ACNR case was included in the study to reflect a baseline with high use of natural gas and low use of coal for electricity generation that is driven by factors other than favorable natural gas supply conditions and low natural gas prices, which are considered in the HOGR case. In order to represent a situation in which increased coal generation is not an available response to higher domestic natural gas prices, coal-fired generation was not allowed to rise above the ACNR baseline level when the DOE/FE export scenarios were implemented. In effect, the model was forced to accommodate added LNG exports using a combination of responses other than a reversion to coal-fired generation.
Caveats regarding interpretation of the analysis results
EIA recognizes that projections of energy markets over a 25-year period are highly uncertain and subject to many events that cannot be foreseen, such as supply disruptions, policy changes, and technological breakthroughs. This uncertainty is particularly true in projecting the effects of exporting significant LNG volumes from the United States because of the following factors:
- NEMS is not a world energy model and does not address the interaction between the potential for additional U.S. natural gas exports and developments in world natural gas markets.
- Global natural gas markets are not fully integrated, and their nature could change substantially in response to significant changes in natural gas trading patterns. Future opportunities to profitably export natural gas from the United States depend on the future of global natural gas markets, the inclusion of relevant terms in specific contracts to export natural gas, as well as on the assumptions in the various cases analyzed.
- Given its focus on the domestic energy system, NEMS does not fully account for interactions between energy prices and the global economy that could benefit the U.S. economy. For example, while NEMS reflects both the positive effects of higher domestic production and the negative effects of higher domestic energy prices on the U.S. economy, it does not include a linkage between energy prices outside the United States and global economic performance. As in the United States, a reduction in the price of imported energy tends to support economic activity. Any reduction in global natural gas prices that might occur as a result of U.S. LNG exports would tend to stimulate the economies of countries that import gas, increasing their demand for both domestic goods and services and imports sourced from the United States and elsewhere. Because the NEMS model does not consider how LNG export might change natural gas pricing in overseas markets, or the implications of such changes for economic activity, this interaction is not reflected in this study. Capturing that linkage would require the use of a global economic model that explicitly includes the energy sector.
- Measures of domestic industrial activity in NEMS are sensitive to both the composition of final U.S. demand and changes in domestic energy prices. However, NEMS does not account for the impact of domestic and global energy price changes on the global utilization pattern for existing manufacturing capacity or the siting of new capacity inside or outside of the United States in energy-intensive industries. Assessment of these effects can be challenging and require careful attention to detail. For example, while the implementation of the export scenarios raises domestic natural gas prices relative to the baseline, increases in production from shale gas resources that provide most of the natural gas used to increase LNG exports also increase the projected domestic supply of natural gas liquids such as ethane and propane that are important feedstock for some energy-intensive industries.
EIA's January 2012 analysis of LNG exports, Effect of Increased Natural Gas Exports on Domestic Energy Markets, includes an extensive discussion of caveats and issues involving the representation of global natural gas markets and their interaction with the North American market. Much of that discussion also applies to the analysis contained in this updated report. Additional observations regarding issues surrounding the estimation of economic impacts of the export scenarios are provided in the economic results section of this report.
Summary of results
- Increased LNG exports lead to increased natural gas prices. Starting from the AEO2014 Reference case baseline, projected average natural gas prices in the Lower 48 states received by producers in the export scenarios are 4% (12-Bcf/d scenario) to 11% (20-Bcf/d scenario) more than their base projection over the 2015-40 period. Percentage changes in delivered natural gas prices, which include charges for gas transportation and distribution, are lower than percentage changes in producer prices, particularly for residential and commercial customers. Starting from the AEO2014 Reference case baseline, projected average Lower 48 states residential natural gas prices in the export scenarios are 2% (12-Bcf/d scenario) to 5% (20-Bcf/d scenario) above their base projection over the 2015-40 period.
- Natural gas markets in the United States balance in response to increased LNG exports mainly through increased natural gas production. Across the different export scenarios and baselines, higher natural gas production satisfies about 61% to 84% of the increase in natural gas demand from LNG exports, with a minor additional contribution from increased imports from Canada. Across most cases, about three-quarters of this increased production is from shale sources.
- Supply from higher domestic production is augmented by reductions in natural gas use by domestic end-users, who respond to higher domestic natural gas prices. As a result of higher natural gas prices, the electric generation mix shifts towards other generation sources, including coal and renewables, with some decrease in total generation as electricity prices rise. The reduction in the average annual level of gas-fired generation over the 2015-40 period ranges from 30 to 146 billion kilowatthours (kWh), starting from levels that range from 1200 to 1782 billion kWh across the five baselines used in this study. There is also a small reduction in natural gas use in all sectors from efficiency improvements and conservation.
- Increased LNG exports result in higher total primary energy use and energy-related CO2 emissions in the United States. The 0.1% to 0.6% increase in total primary energy use and a -0.1% to 0.6% change in CO2 emissions relative to baseline over the 2015-40 period reflect both increased use of natural gas to fuel added liquefaction and fuel switching in the electric power sector that for some cases increases both fuel use and emissions intensity.
- Consumer expenditures for natural gas and electricity increase modestly with added LNG exports. On average, from 2015 to 2040, natural gas bills paid by end-use consumers in the residential, commercial, and industrial sectors combined increase 1% to 8% over a comparable baseline case, depending on the export scenario and case, while increases in electricity bills paid by end-use customers range from 0% to 3%. These estimates reflect the combined impact of higher prices and small reductions in natural gas and electricity use.
- Added U.S. LNG exports result in higher levels of economic output, as measured by real gross domestic product as (GDP). Increased energy production spurs investment, which more than offsets the adverse impact of somewhat higher energy prices when the export scenarios are applied. Economic gains, measured as changes in the level of GDP relative to baseline, range from 0.05% to 0.17% and generally increase with the amount of added LNG exports required to fulfill an export scenario for the applicable baseline. As noted in the previous discussion of caveats, EIA’s NEMS model is focused on the U.S. energy system and the domestic economy and does not address several key international linkages that may increase economic benefits.
- Added U.S. LNG exports result in higher levels of domestic consumption expenditures for goods and services in most cases. Domestic consumption is influenced more by movements in energy prices, than increased energy production. In most cases, U.S. consumers increase their consumption expenditures as the positive impacts of increased energy production outweigh energy price changes. As energy prices increase by more than 10% above baseline, then consumption changes become very small to negative in some instances. Consumption gains range from 0.0% to 0.08% and generally increase with the amount of added LNG exports required to fulfill an export scenario for the applicable baseline.
- Results for export scenarios using baselines representing higher domestic demand for natural gas than in the Reference case both economy-wide (HEG case) and specifically for electric power generation (ACNR case) differ only slightly from those using the Reference case baseline. Although domestic gas use is higher in the HEG and ACNR baselines than in the Reference baseline, the preponderance of the energy market response to added LNG exports occurs on the supply side, with similar price, expenditure, and economic effects across the three baselines.
- Results for export scenarios using the HOGR and LOGR baselines that respectively make more optimistic and more pessimistic assumptions regarding natural gas resources and technology than the Reference case show some differences from those using the other baselines. The amount of added LNG exports to fulfill the export scenarios is smaller for the HOGR baseline, which starts with relatively high LNG exports, than for other baselines. At the same time, the greater ability to increase production also holds down increases in natural gas prices. The LOGR case is the opposite, requiring the largest amount of added LNG exports to fulfill the export scenarios under supply conditions that make it more difficult and costly to raise production, leading to modeled outcomes with the highest impacts on natural gas prices and the largest diversions of natural gas from domestic end uses. As noted in the introduction, competition in global LNG markets is likely to prevent the realization of high LNG exports under the unfavorable domestic supply conditions of the LOGR case.
- A slower, more realistic, ramp-up in LNG export capability results in slightly lower price impacts in the early years of the projection and delays increases in domestic natural gas production that support higher LNG exports. In the scenarios specified by DOE/FE, LNG exports from the Lower 48 states start in 2015 and rise rapidly to reach 12 Bcf/d by 2020. EIA implemented the Alt 20-Bcf/d scenario, under Reference case conditions. In EIA's Alt 20-Bcf/d scenario, the ramp-up in Lower 48 states LNG exports is delayed but still quite aggressive, reaching 12 Bcf/d in 2023. Comparison of results for the "alt" and "standard" versions of the 20-Bcf/d scenario shows very modest differences in impacts over the entire projection period.
- AEO2014, which includes the cases used as baselines in this study, best reflects EIA's view on LNG exports and U.S. natural gas markets more generally. Consideration of the energy market and economic implications of export scenarios specified by DOE/FE in this analysis should not be construed as reflecting any change in EIA's own projections.
Footnotes
1In the HOGR baseline case, projected Lower 48 states LNG exports exceed 12 Bcf/d, one of the specified DOE/FE scenarios, by the mid-2020s. Although the 12-Bcf/d scenario with the HOGR case assumptions is included in the figures and tables of this report, it is excluded from the narrative of the discussion of the ranges of results due to LNG exports being less than the baseline.
2All prices in this report are in 2012 dollars unless otherwise noted. To convert one thousand cubic feet (Mcf) to MMBtu, a ratio of 1 Mcf to 1.027 MMBtu was used.