Effect of Increased Natural Gas Exports on Domestic Energy Markets as requested by the Office of Fossil Energy
Release date: January 19, 2012
Introduction
This report responds to an August 2011 request from the Department of Energy’s Office of Fossil Energy (DOE/FE) for an analysis of “the impact of increased domestic natural gas demand, as exports.” Appendix A provides a copy of the DOE/FE request letter. Specifically, DOE/FE asked the U.S. Energy Information Administration (EIA) to assess how specified scenarios of increased natural gas exports could affect domestic energy markets, focusing on consumption, production, and prices.
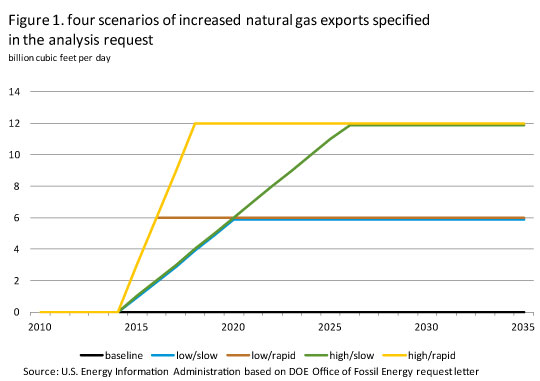
DOE/FE provided four scenarios of export-related increases in natural gas demand (Figure 1) to be considered:
- 6 billion cubic feet per day (Bcf/d), phased in at a rate of 1 Bcf/d per year (low/slow scenario),
- 6 Bcf/d phased in at a rate of 3 Bcf/d per year (low/rapid scenario),
- 12 Bcf/d phased in at a rate of 1 Bcf/d per year (high/slow scenario), and
- 12 Bcf/d phased in at a rate of 3 Bcf/d per year (high/rapid scenario).
Total marketed natural gas production in 2011 was about 66 Bcf/d. The two ultimate levels of increased natural gas demand due to additional exports in the DOE/FE scenarios represent roughly 9 percent or 18 percent of current production.
DOE/FE requested that EIA consider the four scenarios of increased natural gas exports in the context of four cases from the EIA’s 2011 Annual Energy Outlook (AEO2011) that reflect varying perspectives on the domestic natural gas supply situation and the growth rate of the U.S. economy. These are:
- the AEO2011 Reference case,
- the High Shale Estimated Ultimate Recovery (EUR) case (reflecting more optimistic assumptions about domestic natural gas supply prospects, with the EUR per shale gas well for new, undrilled wells assumed to be 50 percent higher than in the Reference case),
- the Low Shale EUR case (reflecting less optimistic assumptions about domestic natural gas supply prospects, with the EUR per shale gas well for new, undrilled wells assumed to be 50 percent lower than in the Reference case), and
- the High Economic Growth case (assuming the U.S. gross domestic product will grow at an average annual rate of 3.2 percent from 2009 to 2035, compared to 2.7 percent in the Reference case, which increases domestic energy demand).
DOE/FE requested this study as one input to their assessment of the potential impact of current and possible future applications to export domestically produced natural gas. Under Section 3 of the Natural Gas Act (NGA) (15 U.S.C. § 717b), DOE must evaluate applications to import and export natural gas and liquefied natural gas (LNG) to or from the United States. The NGA requires DOE to grant a permit unless it finds that such action is not consistent with the public interest. As a practical matter, the need for DOE to make a public interest judgment applies only to trade involving countries that have not entered into a free trade agreement (FTA) with the United States requiring the national treatment for trade in natural gas and LNG.
Analysis approach
EIA used the AEO2011 Reference case issued in April 2011 as the starting point for its analysis and made several changes to the model to accommodate increased exports. EIA exogenously specified additional natural gas exports from the United States in the National Energy Modeling System (NEMS), as the current version of NEMS does not generate an endogenous projection of LNG exports. EIA assigned these additional exports to the West South Central Census Division.1 Any additional natural gas consumed during the liquefaction process is counted within the total additional export volumes specified in the DOE/FE scenarios. Therefore the net volumes of LNG produced for export are roughly 10 percent below the gross volumes considered in each export scenario.
Other changes in modeled flows of gas into and out of the lower-48 United States were necessary to analyze the increased export scenarios. U.S. natural gas exports to Canada and U.S. natural gas imports from Mexico are exogenously specified in all of the AEO2011 cases. U.S. imports of natural gas from Canada are endogenously set in the model and continue to be so for this study. However, U.S. natural gas exports to Mexico and U.S. LNG imports that are normally determined endogenously within the model were set to the levels projected in the associated AEO2011 cases for this study. Additionally, EIA assumed that an Alaska pipeline, which would transport Alaskan produced natural gas into the lower-48 United States, would not be built during the forecast period in any of the cases in order to isolate the lower-48 United States supply response. Due to this restriction, both the AEO2011 High Economic Growth and Low Shale EUR cases were rerun, as those cases had the Alaska pipeline entering service during the projection period in the published AEO2011.
Caveats regarding interpretation of the analysis results
EIA recognizes that projections of energy markets over a 25-year period are highly uncertain and subject to many events that cannot be foreseen, such as supply disruptions, policy changes, and technological breakthroughs. This is particularly true in projecting the effects of exporting significant natural gas volumes from the United States due to the following factors:
- NEMS is not a world energy model and does not address the interaction between the potential for additional U.S. natural gas exports and developments in world natural gas markets.
- Global natural gas markets are not integrated and their nature could change substantially in response to significant changes in natural gas trading patterns. Future opportunities to profitably export natural gas from the United States depend on the future of global natural gas markets, the inclusion of relevant terms in specific contracts to export natural gas, as well as on the assumptions in the various cases analyzed.
- Macroeconomic results have not been included in the analysis because the links between the energy and macroeconomic modules in NEMS do not include energy exports.
- NEMS domestic focus makes it unable to account for all interactions between energy prices and supply/demand in energy-intensive industries that are globally competitive. Most of the domestic industrial activity impacts in NEMS are due to changes in the composition of final demands rather than changes in energy prices. Given its domestic focus, NEMS does not account for the impact of energy price changes on the global utilization pattern for existing capacity or the siting of new capacity inside or outside of the United States in energy-intensive industries.
Representation of natural gas markets
Unlike the oil market, current natural gas markets are not integrated globally. In today's markets, natural gas prices span a range from $0.75 per million British thermal units (MMBtu) in Saudi Arabia to $4 per MMBtu in the United States and $16 per MMBtu in Asian markets that rely on LNG imports. Prices in European markets, which reflect a mix of spot prices and contract prices with some indexation to oil, fall between U.S and Asian prices. Spot market prices at the U.K. National Balancing Point averaged $9.21 per MMBtu during November 2011.
Liquefaction projects typically take four or more years to permit and build and are planned to run for at least 20 years. As a result, expectations of future competitive conditions over the lifetime of a project play a critical role in investment decisions. The current large disparity in natural gas prices across major world regions, a major driver of U.S. producers’ interest in possible liquefaction projects to increase natural gas exports, is likely to narrow as natural gas markets become more globally integrated. Key questions remain regarding how quickly convergence might occur and to what extent it will involve all or only some global regions. In particular, it is unclear how far converged prices may reflect purely “gas on gas” competition, a continuing relationship between natural gas and oil prices as in Asia (and to a lesser extent in Europe), or some intermediate outcome. As an example of the dynamic quality of global gas markets, recent regulatory changes combined with abundant supplies and muted demands appear to have put pressure on Europe’s oil-linked contract gas prices.
U.S. market conditions are also quite variable, as monthly average Henry Hub spot prices have ranged from over $12 to under $3 per MMBtu over the past five years. Furthermore, while projected Henry Hub prices in the AEO2011 Reference case reach $7.07 per MMBtu in 2035, in the High and Low Shale EUR cases prices in 2035 range from $5.35 per MMBtu to $9.26 per MMBtu.2 For purposes of this study, the scenarios of additional exports posited by DOE/FE in their request do not vary across the different baseline cases that are considered. In reality, given available prices in export markets, lower or higher U.S. natural gas prices would tend to make any given volume of additional exports more or less likely.
The prospects for U.S. LNG exports depend greatly on the cost-competitiveness of liquefaction projects in the United States relative to those at other locations. The investment to add liquefaction capacity to an existing regasification terminal in the United States is significant, typically several times the original cost of a regasification-only terminal. However, the ability to make use of existing infrastructure, including natural gas processing plants, pipelines, and storage and loading facilities means that U.S. regasification terminals can reduce costs relative to those that would be incurred by a “greenfield” LNG facility. Many of the currently proposed LNG supply projects elsewhere in the world are integrated standalone projects that would produce, liquefy, and export stranded natural gas. These projects would require much more new infrastructure, entailing not only the construction of the liquefaction plant from the ground up, but also storage, loading, and production facilities, as well pipelines and natural gas processing facilities.
While the additional infrastructure for integrated standalone projects adds considerably to their cost, such projects can be sited at locations where they can make use of inexpensive or stranded natural gas resources that would have minimal value independent of the project. Also, while these projects may require processing facilities to remove impurities and liquids from the gas, the value of the separated liquids can improve the overall project economics. On the other hand, liquefaction projects proposed for the lower-48 United States plan to use pipeline gas drawn from the largest and most liquid natural gas market in the world. Natural gas in the U.S. pipeline system has a much greater inherent value than stranded natural gas, and most of the valuable natural gas liquids have already been removed.
Future exports of U.S. LNG depend on other factors as well. Potential buyers may place additional value on the greater diversity of supply that North American liquefaction projects provide. Also, the degree of regulatory and other risks are much lower for projects proposed in countries like the United States, Canada, and Australia than for those proposed in countries like Iran, Venezuela, and Nigeria. However, due to relatively high shipping costs, LNG from the United States may have an added cost disadvantage in competing against countries closer to key markets, such as in Asia. Finally, LNG projects in the United States would frequently compete not just against other LNG projects, but against other natural gas supply projects aimed at similar markets, such as pipeline projects from traditional natural gas sources or projects to develop shale gas in Asia or Europe.
Macroeconomic considerations related to energy exports and global competition in energy-intensive industries
Macroeconomic results have not been included in the analysis because energy exports are not explicitly represented in the NEMS macroeconomic module. 3 The macroeconomic module takes energy prices, energy production, and energy consumption as inputs (or assumptions) from NEMS energy modules. The macroeconomic module then calculates economic drivers that are passed back as inputs to the NEMS energy modules. Each energy module in NEMS uses different economic inputs; however these economic concepts are encompassed by U.S. gross domestic product (GDP), a summary measure describing the value of goods and services produced in the economy.4
The net exports component of GDP in the macroeconomic module, however, does not specifically account for energy exports. As a result, increases in energy exports generated in the NEMS energy modules are not reflected as increases in net exports of goods and services in the macroeconomic module. This results in an underestimation of GDP, all else equal. The components of GDP are calculated based on this underestimated amount as well, and do not reflect the increases in energy exports This is particularly important in the industrial sector, where the value of its output will not reflect the increased energy exports either.
The value of output in the domestic industrial sector in NEMS depends in general on both domestic and global demand for its products, and on the price of inputs. Differences in these factors between countries will also influence where available production capacity is utilized and where new production capacity is built in globally competitive industries. For energy-intensive industries, the price of energy is particularly important to utilization decisions for existing plants and siting decisions for new ones. Given its domestic focus, however, NEMS does not account for the impact of energy price changes on global utilization pattern of existing capacity or the siting of new capacity inside or outside of the United States in energy-intensive industries. Capturing these linkages requires an international model of the particular industry in question, paired with a global macroeconomic model.
Summary of Results
Increased natural gas exports lead to higher domestic natural gas prices, increased domestic natural gas production, reduced domestic natural gas consumption, and increased natural gas imports from Canada via pipeline.
Impacts overview
- Increased natural gas exports lead to increased natural gas prices. Larger export levels lead to larger domestic price increases, while rapid increases in export levels lead to large initial price increases that moderate somewhat in a few years. Slower increases in export levels lead to more gradual price increases but eventually produce higher average prices during the decade between 2025 and 2035.
- Natural gas markets in the United States balance in response to increased natural gas exports largely through increased natural gas production. Increased natural gas production satisfies about 60 to 70 percent of the increase in natural gas exports, with a minor additional contribution from increased imports from Canada. Across most cases, about three-quarters of this increased production is from shale sources.
- The remaining portion is supplied by natural gas that would have been consumed domestically if not for the higher prices. The electric power sector accounts for the majority of the decrease in delivered natural gas. Due to higher prices, the electric power sector primarily shifts to coal-fired generation, and secondarily to renewable sources, though there is some decrease in total generation due to the higher price of natural gas. There is also a small reduction in natural gas use in all sectors from efficiency improvements and conservation.
- Even while consuming less, on average, consumers will see an increase in their natural gas and electricity expenditures. On average, from 2015 to 2035, natural gas bills paid by end-use consumers in the residential, commercial, and industrial sectors combined increase 3 to 9 percent over a comparable baseline case with no exports, depending on the export scenario and case, while increases in electricity bills paid by end-use customers range from 1 to 3 percent. In the rapid growth cases, the increase is notably greater in the early years relative to the later years. The slower export growth cases tend to show natural gas bills increasing more towards the end of the projection period.
Footnotes
1This effectively assumes that incremental LNG exports would be shipped out of the Gulf Coast States of Texas or Louisiana.
2All prices in this report are in 2009 dollars unless otherwise noted. For the Low Shale EUR case used in this study the Henry Hub price in 2035 is $9.75 per MMBtu, slightly higher than in the AEO2011 case with the Alaska pipeline projected to be built towards the end of the projection period.
3In the macroeconomic model, energy exports are used in two places: estimating exports of industrial supplies and materials and estimating energy's impact on the overall production of the economy. To assess their impact on overall production, energy exports are included in the residual between energy supply (domestic production plus imports) and energy demand. This residual also includes changes in inventory.
4GDP is defined as the sum of consumption, investment, government expenditure and net exports (equal to exports minus imports).