|
Analysis of Crude Oil Production in the Arctic National Wildlife Refuge |
|||||
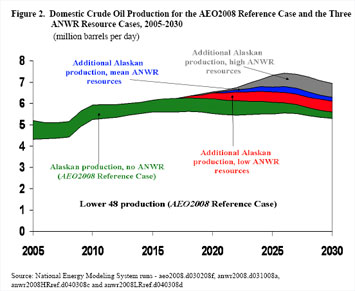
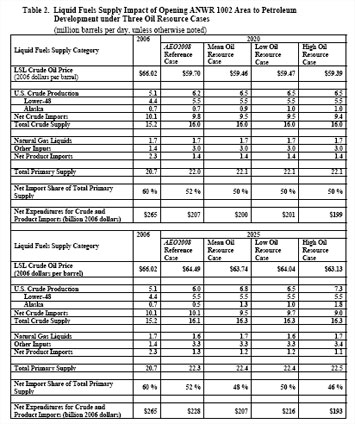
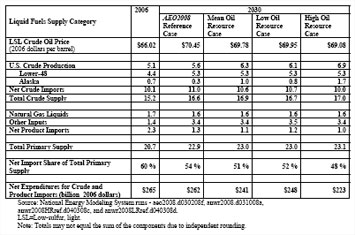
Results In the AEO2008 reference case, U.S. conventional crude oil production grows from 5.1 million barrels per day in 2006 to a peak of 6.3 million barrels per day in 2018, and then declines to 5.6 million barrels per day in 2030 (Figure 2 and Table 2). The shape of the U.S. production profile is largely driven by lower-48 offshore oil production, which rises from 1.4 million barrels per day in 2006 to 2.4 million barrels per day in 2015, and then falls to 1.9 million barrels per day in 2030. Lower-48 onshore oil production grows slightly through 2030 because high crude oil prices stimulate the growth in carbon dioxide enhanced oil recovery (EOR) production, which offsets the decline in the other lower-48 onshore oil production. In the AEO2008 reference case, Alaska crude oil production (without ANWR) declines from 741,000 barrels per day in 2006 to about 520,000 barrels per day in 2014. After 2014, Alaska oil production increases due to the discovery and development of new offshore oil fields that are expected to be found off the Alaska North Slope.16 These new fields raise Alaska oil production to about 700,000 barrels per day in 2020. After 2020, Alaska oil production declines to about 300,000 barrels per day in 2030. In all three ANWR resource cases, ANWR crude oil production begins in 2018 and grows during most of the projection period before production begins to decline. In the mean oil resource case, ANWR oil production peaks at 780,000 barrels per day in 2027. The low- resource-case production peaks at 510,000 barrels per day in 2028, while the high- resource-case production peaks at 1,450,000 barrels per day in 2028. Cumulative oil production resulting from the opening of ANWR from 2018 through 2030 amounts to 2.6 billion barrels in the mean resource case, 1.9 billion barrels in the low resource case, and 4.3 billion barrels in the high resource case. The opening of ANWR to oil and gas development includes the following impacts:
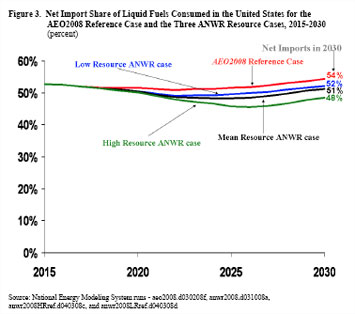
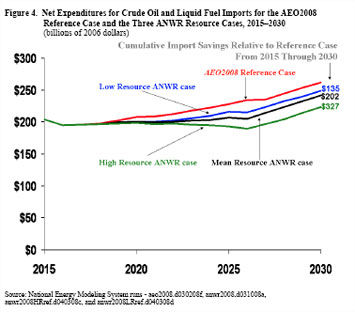
The remainder of this section will focus primarily on the first four impacts, because the employment impacts are difficult to determine for oil fields being developed on the Alaska North Slope. With respect to the world oil price impact, projected ANWR oil production constitutes between 0.4 and 1.2 percent of total world oil consumption in 2030, based on the low and high resource cases, respectively.17 Consequently, ANWR oil production is not projected to have a large impact on world oil prices. Relative to the AEO2008 reference case, ANWR oil production is projected to have its largest oil price reduction impacts as follows: a reduction in low-sulfur, light (LSL) crude oil18 prices of $0.41 per barrel (2006 dollars) in 2026 in the low oil resource case, $0.75 per barrel in 2025 in the mean oil resource case, and $1.44 per barrel in 2027 in the high oil resource case. Assuming that world oil markets continue to work as they do today, the Organization of Petroleum Exporting Countries (OPEC) could neutralize any potential price impact of ANWR oil production by reducing its oil exports by an equal amount. High oil prices and high Corporate Average Fuel Economy (CAFE) standards are projected to restrain the growth in future U.S. liquid fuels consumption. In the AEO2008 reference case, total U.S. liquid fuels consumption grows slowly from 20.7 million barrels per day in 2006 to 22.8 million barrels per day in 2030. Lower projected U.S. liquid fuels consumption results in ANWR oil production causing a larger percentage reduction in future oil and liquid product imports than was the case in prior ANWR analyses conducted by EIA. Every barrel of ANWR oil production reduces crude oil imports by about a barrel (Figure 3 and Table 2). In the AEO2008 reference case, the proportion of crude oil and liquid fuel imports to total supply remains relatively constant during the 2018 through 2025 time period at an average value of 51 percent. After 2025, reference case oil dependency increases to about 54 percent of U.S. liquid fuels supply in 2030. Because U.S. liquid fuels consumption grows slowly during the entire projection period, the lowest import dependency levels occur between 2022 and 2026 across the three resource cases.19 The mean oil resource case projects a minimum import share of 48 percent in 2024, before rising to 51 percent in 2030. The low and high resource cases project minimum import shares of 49 and 46 percent in 2022 and 2026, respectively. The reduction in oil import volumes also reduces the level of expenditures on crude oil and liquid fuel imports (Figure 4 and Table 2). In the AEO2008 reference case, high projected oil prices cause cumulative net U.S. expenditures on imported oil and liquid fuels to cost about $2.9 trillion (2006 dollars) between 2018 and 2030. The mean oil resource case reduces this import expenditure by $202 billion dollars, or about 7 percent. In the low and high resource cases, ANWR oil production reduces cumulative net expenditures on imported crude oil and liquid fuels by about $135 to $327 billion (2006 dollars), respectively. As a result, the opening of ANWR to Federal oil and natural gas leasing improves the U.S. balance of trade by $135 to $327 billion during the 2018 through 2030 timeframe, based on the world oil prices projected in the AEO2008 reference case. The development of ANWR oil resources potentially extends the lifetime operation of TAPS. Currently, TAPS is believed to be uneconomic to operate once the oil throughput falls below 200,000 barrels per day.20 Although the reference case projects North Slope production to be above this minimum level, at about 280,000 barrels per day in 2030, the development of ANWR oil resources extends the life of this pipeline well beyond 2030. Greater TAPS throughput also reduces oil transportation rates, thereby prolonging the life of existing oil fields and encouraging the development of new, small North Slope oil fields. ANWR Production Uncertainties There is much uncertainty regarding the impact of opening ANWR on U.S. oil production and imports, due to several factors:
Although there is considerable uncertainty regarding future ANWR oil production, the current upper limit to ANWR oil production is the transportation capacity of TAPS. TAPS has maximum throughput capacity of 2.136 million barrels per day. 21 The high ANWR oil resource case comes closest to reaching this pipeline capacity, when total North Slope oil production peaks at 1.9 million barrels per day in 2026.
|